A Guide to Customer Health Score
A customer health score is a metric used to predict the likelihood of a customer churning, growing, or staying loyal. It consolidates complex data points—from product usage and support interactions to customer feedback—into a single, easy-to-understand rating. This score, often categorized as healthy, at-risk, or poor, provides a clear signal for customer-facing teams to act on.
Think of It as Your Customer Weather Forecast
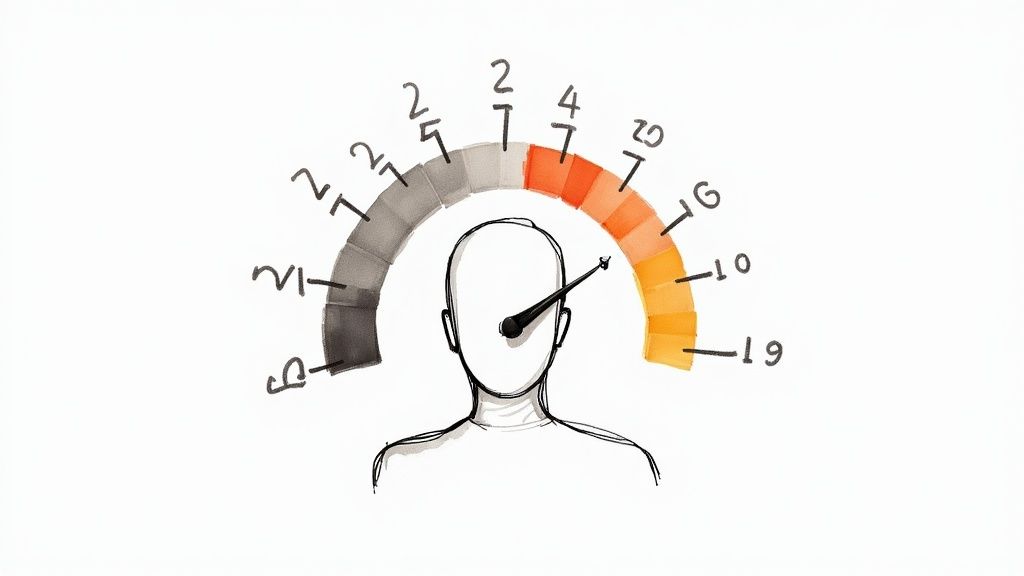
Imagine a customer health score as a weather forecast for your customer relationships. Instead of relying on gut feelings, you get an objective, data-driven view of each account's strength. This metric shows you which customers are enjoying sunny skies and which might be heading for a storm, allowing you to intervene proactively.
But this score is more than just a churn detector. It’s a strategic tool that can revolutionize how your teams operate. By synthesizing diverse data into a unified score, it establishes a common language for everyone, from customer success and sales to product development.
Why This Single Metric Is a Game-Changer
A well-designed customer health score serves as the compass for your entire retention strategy. It shifts customer success managers (CSMs) from a reactive mode—where they’re just putting out fires—to a proactive one. They no longer have to wait for a cancellation email to land in their inbox. Instead, they can identify warning signs weeks or even months in advance.
This proactive approach directly impacts revenue and growth by helping your teams:
- Prioritize their efforts: CSMs can focus their attention on accounts showing early signs of disengagement before the issue escalates.
- Spot upsell opportunities: It becomes easy to identify your happiest, most engaged customers who are prime candidates for new features or plan upgrades.
- Shape the product roadmap: By analyzing which features and behaviors correlate with high health scores, your product team gains invaluable data to guide development.
At its heart, a customer health score is about replacing guesswork with data. It’s the difference between hoping your customers are happy and knowing exactly where they stand, so you can act with confidence and precision.
The Science Behind the Score
Building an effective customer health score is a complex task. The most reliable models are developed using feedback from hundreds of industry professionals and validated against massive datasets. The development process for leading scores has involved rigorous testing on over 10 million data points to ensure accuracy. This scale of analysis is what it takes to create a metric that can reliably predict customer behavior. This ensures the score you're relying on has a solid, data-backed foundation. You can learn more about the evolution of customer health score models and how they've become so sophisticated.
The Metrics That Build Your Score
A robust customer health score isn't built on a single data point. It’s a mosaic, pieced together from various signals that, when combined, reveal the complete picture of your customer relationship.
Relying only on login frequency is like trying to understand a movie by watching a single scene—you’re guaranteed to miss the plot. To build a score that is both predictive and genuinely useful, you need to pull data from several core areas.
Product Usage Signals
This is the foundation. Are your customers actively using your product to achieve their goals? If not, you have a problem. Low usage is almost always the first sign that a customer is heading toward churn, making these metrics essential to track.
Look for clues in areas like:
- Adoption of Core Features: Are they leveraging the "sticky" features that deliver the most value? Ignoring these is a major red flag.
- Login Frequency: While it doesn't tell the whole story, it’s a basic sign of life. A sudden drop-off in logins is often an early warning.
- Session Duration: This indicates how deeply they engage during each session. Short, fleeting visits suggest they aren't finding what they need.
- License Utilization: For multi-seat accounts, this is critical. It shows if the entire team is bought in, as low utilization puts the renewal at risk.
The actions customers take inside your product speak louder than words. Consistently low engagement with value-driving features is one of the clearest signs that a customer is drifting away.
Customer Engagement Signals
Next, look beyond the product itself. How are customers interacting with your company as a whole? These signals provide crucial context about the relationship and their overall investment in your success.
You'll want to keep an eye on:
- Support Ticket Volume & Resolution: A high volume of unresolved tickets points to frustration. Conversely, quick resolutions can strengthen the relationship.
- Community & Webinar Participation: Active participation in forums or training sessions shows they want to learn and grow with your product.
- Marketing Communication Engagement: Do they open your newsletters or click on new feature announcements? This is a great indicator of their interest in your ecosystem.
Understanding key digital marketing performance metrics can also offer surprisingly useful insights here, adding another layer to your health score.
Direct Feedback and Financials
Finally, you must incorporate what your customers are telling you directly, alongside hard financial data. This adds human sentiment and business reality to your usage metrics.
Key metrics to include are:
- NPS and CSAT Scores: These classic surveys provide a direct pulse on customer loyalty and satisfaction. They should not be ignored.
- Payment History: On-time payments signal a stable, healthy relationship. Late payments can be a symptom of a much deeper issue.
To give you a clearer idea of how these different data points fit together, here’s a quick breakdown of some essential metrics.
Table: Essential Metrics for Your Customer Health Score
Ultimately, combining these varied signals is what creates a reliable health score. For more help on choosing the right data, check out our complete guide on essential client success metrics. It ensures the final score is a true reflection of the customer's health.
How to Calculate Your Customer Health Score
Transforming the abstract concept of "customer wellness" into a tangible number is the core of building a customer health score. This process is not just about crunching numbers; it’s about creating a weighted model that reflects what truly drives success for your customers and, consequently, for your business.
This ensures your score is an accurate reflection of reality. For instance, a customer deeply using a core product feature is a far better sign of health than one who simply logs in every day without engaging further. The calculation process flows logically from data collection to providing your team with clear, actionable next steps.
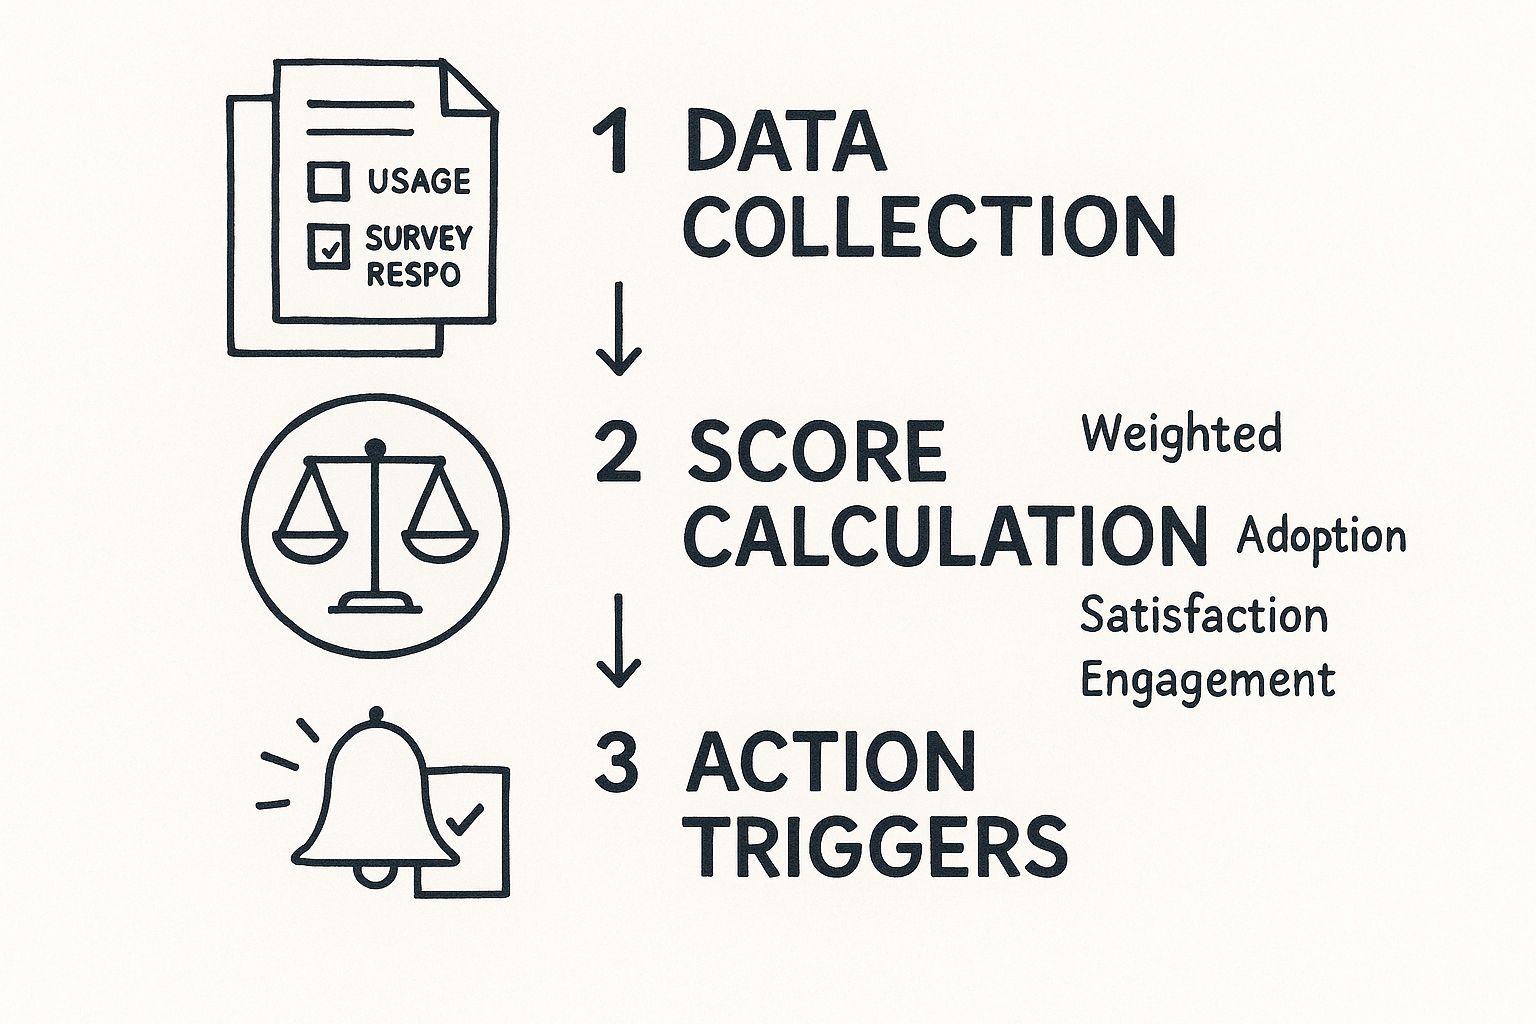
As you can see, the process involves three main stages: collecting raw data (like usage logs and feedback), processing it through your weighted model to generate a score, and then using that score to trigger alerts and tasks for your team.
Step 1: Identify and Weight Your Metrics
First, you need to select a handful of metrics that are the strongest predictors of retention and growth. You don't need dozens; start with three to five of the most impactful indicators.
Once you have your metrics, assign a weight to each one based on its relative importance. The key is that all your weights must add up to 100%.
Let’s imagine a B2B SaaS company building their model. It might look something like this:
- Core Feature Adoption: 40%
- Weekly Active Users (WAU): 25%
- Net Promoter Score (NPS): 20%
- Number of Support Tickets: 15%
This model clearly prioritizes deep product engagement. If you're looking for inspiration on the feedback side, exploring different NPS survey examples can help you fine-tune how you gather and use that data in your score.
Step 2: Score Each Metric Individually
Now that you have your weighted metrics, you need a consistent way to score each one for every customer. A simple 0-100 scale works well for this. You’ll set benchmarks to define what good, average, and poor scores look like for that specific metric.
Let's continue with our "Core Feature Adoption" example:
- Uses all 3 core features: 100 points
- Uses 2 core features: 60 points
- Uses 1 core feature: 20 points
- Uses 0 core features: 0 points
You would create a similar scoring guide for all your chosen metrics. This is how you translate raw customer data into a clean, standardized score.
Step 3: Calculate the Final Health Score
Now it's time to put it all together. To get the final customer health score, you multiply each metric's individual score by its weight, then sum the results.
Let’s run the numbers for a hypothetical "Customer A":
- Feature Adoption: Score of 60 x 40% weight = 24 points
- WAU: Score of 80 x 25% weight = 20 points
- NPS: Score of 90 x 20% weight = 18 points
- Support Tickets: Score of 50 x 15% weight = 7.5 points
Final Customer Health Score for Customer A: 24 + 20 + 18 + 7.5 = 69.5
Step 4: Define Your Health Thresholds
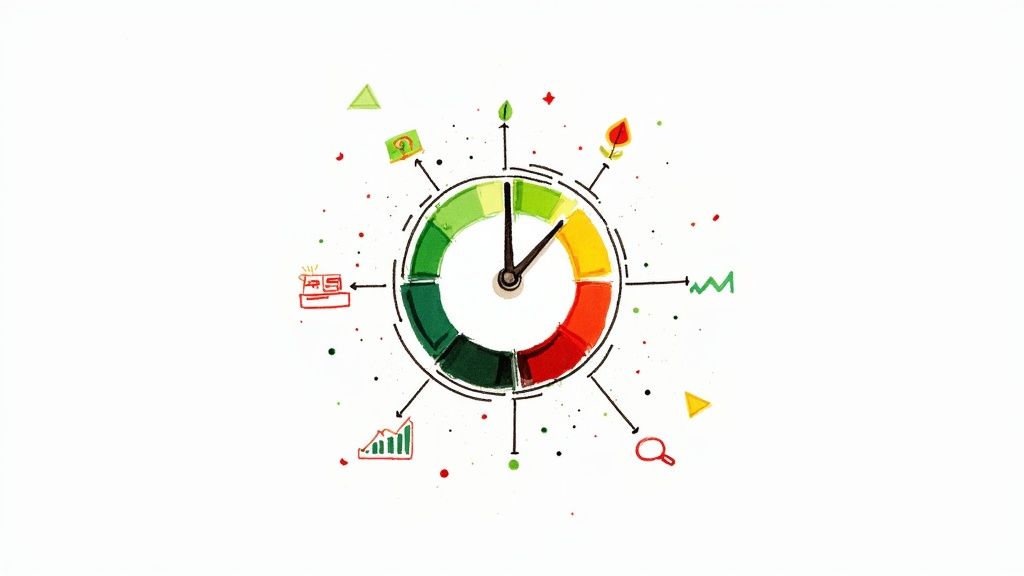
A score like 69.5 is meaningless in a vacuum. The final, critical step is to create clear thresholds that make the score immediately useful. A simple, color-coded system is the most common approach:
- Green (Healthy): 80-100
- Yellow (At-Risk): 50-79
- Red (Poor): 0-49
With these thresholds, Customer A’s score of 69.5 places them squarely in the "Yellow" or at-risk zone. This provides an instant signal to the customer success team that this account needs proactive attention before they consider churning.
Putting Your Customer Health Score Into Action

A customer health score is just a number on a dashboard until you act on it. The real value emerges when the score becomes an integral part of your daily operations, transforming from a passive metric into a powerful tool for boosting retention and growth across the entire company.
The goal is to weave these scores into the fabric of how your customer-facing teams operate. When this happens, insights are not just seen—they’re acted upon, creating a unified, proactive strategy for managing customer relationships.
For Customer Success Teams
For a Customer Success Manager (CSM), a health score acts as a compass for their day. Instead of constantly reacting to problems, they can anticipate issues and strategically manage their portfolio of accounts. This shift from reactive to proactive is not only less stressful but also leads to far better outcomes.
Here’s how CSMs can put health scores to work:
- Prioritize Outreach: A quick glance at their dashboard reveals which customers need them most. They can focus on engaging "yellow" accounts before they turn "red," effectively preventing churn.
- Spot Upsell Opportunities: Who are your happiest customers? The ones with consistently high "green" scores. These are your biggest advocates and the perfect candidates for case studies, testimonials, or an introduction to premium features.
- Personalize Engagement: A low score due to poor feature adoption requires a different conversation than one caused by a series of support tickets. The score gives CSMs the context needed for meaningful check-ins. A key reason for tracking customer health is to build loyalty; check out these proven strategies to increase customer retention to get the most out of your efforts.
For Product Teams
Your product team can leverage aggregated health data as a direct pipeline to understanding what users truly value. By analyzing which behaviors and features correlate with high scores, they gain data-backed insights that are invaluable for shaping the product roadmap.
A customer health score pushes product development past simple feature requests. It helps teams see which features create sticky, successful customers, showing them exactly where to double down to drive real value.
This data helps them answer crucial questions like:
- Do customers who regularly use Feature X have higher health scores?
- Did we see a dip in scores right after our last product update?
- Which steps in our onboarding flow are most connected to long-term customer health?
For Marketing Teams
Health scores are also a marketer's secret weapon for segmentation. Instead of broadcasting generic campaigns, the marketing team can tailor their messaging with surgical precision based on a customer's current health status.
For instance, they could build specific campaigns to:
- Re-engage At-Risk Users: A targeted email sequence offering helpful training resources could be automatically sent to all accounts that slip into the "yellow" category.
- Mobilize Your Advocates: Your "green" customers are a potential growth engine. Invite them to join a referral program, leave a review on a third-party site, or participate in a case study.
- Gather Smarter Feedback: Segmenting by score lets you ask better questions. You might ask "red" customers what's missing, while you ask "green" customers what they absolutely love.
Common Mistakes to Avoid
Building a solid customer health score is a game-changer, but it’s easy to fall into a few common traps. If you’re not careful, you could end up with a score that is misleading or, even worse, completely useless. Avoiding these pitfalls is just as crucial as selecting the right metrics.
One of the biggest mistakes teams make is creating a one-size-fits-all model. Your enterprise clients and your SMB customers are worlds apart. They have different goals, use cases, and success criteria. Applying the same scoring logic to everyone is a recipe for disaster and will give you a skewed view of both segments.
Overlooking Qualitative Feedback
Relying solely on quantitative data is another classic blunder. Usage data is great for telling you what customers are doing, but it will never tell you why. A user might log in daily, but behind the screen, they could be incredibly frustrated and actively looking for alternatives.
Ignoring this human element creates a massive blind spot. To get the full story, you need to incorporate qualitative feedback from other sources:
- Surveys: NPS and CSAT scores provide a direct line into customer sentiment.
- Support Tickets: The volume, type, and tone of support interactions reveal a lot about friction points and user frustration.
- CSM Notes: What are your Customer Success Managers hearing on calls? The insights gathered during check-ins and business reviews are invaluable.
A truly reliable customer health score is a blend of hard data and human insight. A customer can look perfectly "healthy" on a dashboard but be a major churn risk because their team is unhappy or their business goals have changed.
Using a Stale or Static Model
Finally, a fatal error is treating your health score as a "set it and forget it" project. Your product evolves, your customers' needs change, and the market never stands still. A scoring model that worked perfectly last year could be completely irrelevant today.
Your health score must be a living metric. Regularly review and validate your model against real-world outcomes like churn and renewals. If you notice a pattern of "green" customers churning, it's a clear signal that the model is broken and needs to be fixed—fast. By continuously refining your approach, you ensure your customer health score remains a sharp, reliable tool for keeping customers happy and growing your business.
Frequently Asked Questions
Even with a solid plan, questions are bound to arise when you start implementing a customer health score system. Getting clear answers to these common sticking points is key to helping your team move forward confidently and build a system that provides useful, actionable insights.
Let's tackle some of the most common questions that pop up.
How Often Should We Update Customer Health Scores?
For most SaaS companies, customer health scores should be updated daily or, at the very least, weekly. This frequency allows your customer success team to get ahead of issues by spotting negative trends long before they escalate into a crisis.
The ideal cadence depends on your business model. In a high-touch, fast-moving environment, daily updates are often necessary. For businesses with longer contract cycles, a weekly refresh might suffice. The key takeaway is that automation is essential. You need an automated process to keep the data fresh so your scores always reflect what's happening right now.
What Is a Good Customer Health Score?
This is a common question, but a "good" score is entirely relative. It all comes down to the thresholds you establish for your own business—your unique definitions for Red, Yellow, and Green. The objective isn't to chase some universal number but to create a score that reliably predicts customer behavior.
A health score is "good" when it's tightly correlated with reality. If customers in your 'Green' category are the ones who consistently renew and grow their accounts, while your 'Red' customers are the ones who churn, you've built a model that works.
Ultimately, you want to see the majority of your customers in the healthy, green category. Remember to continuously validate and tweak your model to ensure it remains accurate over time.
Can a Small Business Implement This?
Absolutely. You don't need a massive budget or a complex, specialized platform to get started. A small business can begin by tracking just three to five core metrics you are likely already collecting, such as product usage data, login recency, or the number of support tickets submitted.
You can even manage your first iteration in a simple spreadsheet. Create a basic weighted formula to combine your metrics into a single score. This hands-on approach delivers immediate value, helps you understand what makes your customers successful, and lays the groundwork for a more sophisticated system as you scale.
At Worknet.ai Inc, we transform how you engage customers at every stage. Our AI-powered chat drives trial conversions, boosts product adoption, and provides continuous support to increase retention and uncover expansion opportunities. Learn how Worknet.ai can help you turn more visitors into lifelong customers.
FAQs
.png)
Lorem ipsum dolor sit amet, consectetur adipiscing elit. Suspendisse varius enim in eros elementum tristique. Duis cursus, mi quis viverra ornare, eros dolor interdum nulla, ut commodo diam libero vitae erat. Aenean faucibus nibh et justo cursus id rutrum lorem imperdiet. Nunc ut sem vitae risus tristique posuere.
Lorem ipsum dolor sit amet, consectetur adipiscing elit. Suspendisse varius enim in eros elementum tristique. Duis cursus, mi quis viverra ornare, eros dolor interdum nulla, ut commodo diam libero vitae erat. Aenean faucibus nibh et justo cursus id rutrum lorem imperdiet. Nunc ut sem vitae risus tristique posuere.
Lorem ipsum dolor sit amet, consectetur adipiscing elit. Suspendisse varius enim in eros elementum tristique. Duis cursus, mi quis viverra ornare, eros dolor interdum nulla, ut commodo diam libero vitae erat. Aenean faucibus nibh et justo cursus id rutrum lorem imperdiet. Nunc ut sem vitae risus tristique posuere.
Lorem ipsum dolor sit amet, consectetur adipiscing elit. Suspendisse varius enim in eros elementum tristique. Duis cursus, mi quis viverra ornare, eros dolor interdum nulla, ut commodo diam libero vitae erat. Aenean faucibus nibh et justo cursus id rutrum lorem imperdiet. Nunc ut sem vitae risus tristique posuere.
Lorem ipsum dolor sit amet, consectetur adipiscing elit. Suspendisse varius enim in eros elementum tristique. Duis cursus, mi quis viverra ornare, eros dolor interdum nulla, ut commodo diam libero vitae erat. Aenean faucibus nibh et justo cursus id rutrum lorem imperdiet. Nunc ut sem vitae risus tristique posuere.
Lorem ipsum dolor sit amet, consectetur adipiscing elit. Suspendisse varius enim in eros elementum tristique. Duis cursus, mi quis viverra ornare, eros dolor interdum nulla, ut commodo diam libero vitae erat. Aenean faucibus nibh et justo cursus id rutrum lorem imperdiet. Nunc ut sem vitae risus tristique posuere.
Lorem ipsum dolor sit amet, consectetur adipiscing elit. Suspendisse varius enim in eros elementum tristique. Duis cursus, mi quis viverra ornare, eros dolor interdum nulla, ut commodo diam libero vitae erat. Aenean faucibus nibh et justo cursus id rutrum lorem imperdiet. Nunc ut sem vitae risus tristique posuere.
Lorem ipsum dolor sit amet, consectetur adipiscing elit. Suspendisse varius enim in eros elementum tristique. Duis cursus, mi quis viverra ornare, eros dolor interdum nulla, ut commodo diam libero vitae erat. Aenean faucibus nibh et justo cursus id rutrum lorem imperdiet. Nunc ut sem vitae risus tristique posuere.
Lorem ipsum dolor sit amet, consectetur adipiscing elit. Suspendisse varius enim in eros elementum tristique. Duis cursus, mi quis viverra ornare, eros dolor interdum nulla, ut commodo diam libero vitae erat. Aenean faucibus nibh et justo cursus id rutrum lorem imperdiet. Nunc ut sem vitae risus tristique posuere.
Lorem ipsum dolor sit amet, consectetur adipiscing elit. Suspendisse varius enim in eros elementum tristique. Duis cursus, mi quis viverra ornare, eros dolor interdum nulla, ut commodo diam libero vitae erat. Aenean faucibus nibh et justo cursus id rutrum lorem imperdiet. Nunc ut sem vitae risus tristique posuere.
.webp)
.webp)
.webp)


