A Practical Guide to Client Success Metrics
Client success metrics are the hard numbers that tell you if your customers are actually winning with your product. These aren't just fluffy satisfaction scores; they are direct indicators of value delivery, showing you whether your business is creating real, tangible success for the people who pay you. By tracking the right client success metrics, you can shift from reactive problem-solving to proactively guiding customers toward their goals, ultimately boosting retention and revenue.
What Are Client Success Metrics, Really?
Forget the dry, textbook definitions for a moment. Instead, picture client success metrics as the instruments in a pilot's cockpit.
Each gauge—from altitude to engine temperature—gives you a vital piece of information. A single dial is useful, sure, but seeing them all together gives you a complete picture of the flight's health and trajectory. That's what these metrics do for your business.
They help you shift from constantly putting out fires to proactively steering your clients toward their goals. Instead of waiting for a customer to complain or, worse, cancel their subscription, you're using data to spot turbulence ahead of time and adjust your course.
Client success isn't about keeping customers happy. It’s about making them successful. Happiness is just a wonderful byproduct of that success. These metrics are the language we use to measure it.
From Service Metric To Strategic Imperative
This focus on client outcomes marks a huge shift in how businesses operate. We're moving away from just tracking basic service stats. By 2025, the whole game will be about measuring how effectively you help customers achieve their goals.
Metrics like Customer Satisfaction Score (CSAT), Net Promoter Score (NPS), and the all-important Customer Health Score now provide deep insights into loyalty, retention, and the value customers feel they're getting. When a business truly embraces these indicators, it gets a much clearer picture of where its product shines and where it creates friction. You can learn more about how these indicators are reshaping business in this guide to customer success metrics on Brand24.com.
This proactive approach is non-negotiable for any modern company, especially in SaaS. Relying only on lagging indicators like churn is like realizing your plane is out of fuel mid-flight. By then, it’s far too late.
Why These Metrics Matter Now More Than Ever
In a crowded market, customer loyalty isn't just nice to have—it's your most valuable asset. After all, acquiring a new customer can be five times more expensive than keeping an existing one. Client success metrics give you the roadmap to build that loyalty.
- They create a shared language: When sales, marketing, product, and success teams all look at the same data, everyone finally rallies around what the customer actually wants to achieve.
- They reveal growth opportunities: Is a customer’s health score through the roof? Are they using your product every day? That's your cue to talk about an upsell or expansion.
- They predict your future revenue: Metrics like Net Revenue Retention (NRR) and Customer Lifetime Value (CLV) aren't just numbers on a dashboard; they're a direct reflection of your company's long-term financial health.
To truly grasp how these metrics work together, it's helpful to understand the full range of essential customer service key performance indicators that measure everything from satisfaction to operational speed. This data is the bedrock of any smart, customer-first strategy.
To make things even clearer, here's a quick rundown of the most important metrics.
Core Client Success Metrics at a Glance
This table breaks down the key metrics, what they're actually tracking, and why they're so critical for your business's health and growth.
Think of these as your core flight instruments. By keeping a close eye on each one, you'll have a much better handle on where your customers are headed and how you can help them—and your business—reach new heights.
The Three Pillars of Client Success Data
To get a real handle on client success metrics, you need a way to organize them. Otherwise, you're just staring at a spreadsheet full of numbers, hoping a story will jump out at you. The best way I've found to make sense of it all is to group your metrics into three core pillars. Together, they tell the complete story of your customer's journey and how it impacts your business.
This approach walks you through the customer's experience logically—from their first interactions with your product, to their long-term loyalty, and finally, to the financial impact on your company. Think of it like building a solid foundation first: you can't have a healthy, profitable customer base without strong engagement and retention.
Pillar 1: Engagement and Adoption
This is where it all starts. This first pillar is all about measuring how—and how often—your customers are actually using your product. It’s the bedrock of client success. If people aren't logging in and using your features, they aren't getting value. And if they aren't getting value, they certainly won't be customers for long.
A few key metrics to watch here are:
- Daily/Monthly Active Users (DAU/MAU): This ratio gives you a clear signal of your product's "stickiness." Are people incorporating it into their daily or weekly routines? That's what you want to see.
- Feature Adoption Rate: Are customers using the features that deliver the most value? If you've built a killer feature but nobody's touching it, that's a massive red flag that you need to investigate.
- Session Duration: How much time are users spending in your app when they log in? Longer, more focused sessions often mean they're deeply engaged and solving real problems.
Pillar 2: Retention and Loyalty
While engagement tells you what customers are doing, this pillar tells you how they feel about it and whether they plan to stick around. It’s a powerful mix of hard data (like churn) and customer sentiment, giving you a 360-degree view of loyalty. This is where you find out if the value you're providing is strong enough to forge a lasting relationship.
This infographic lays out some of the most critical metrics that form the backbone of retention and loyalty measurement.
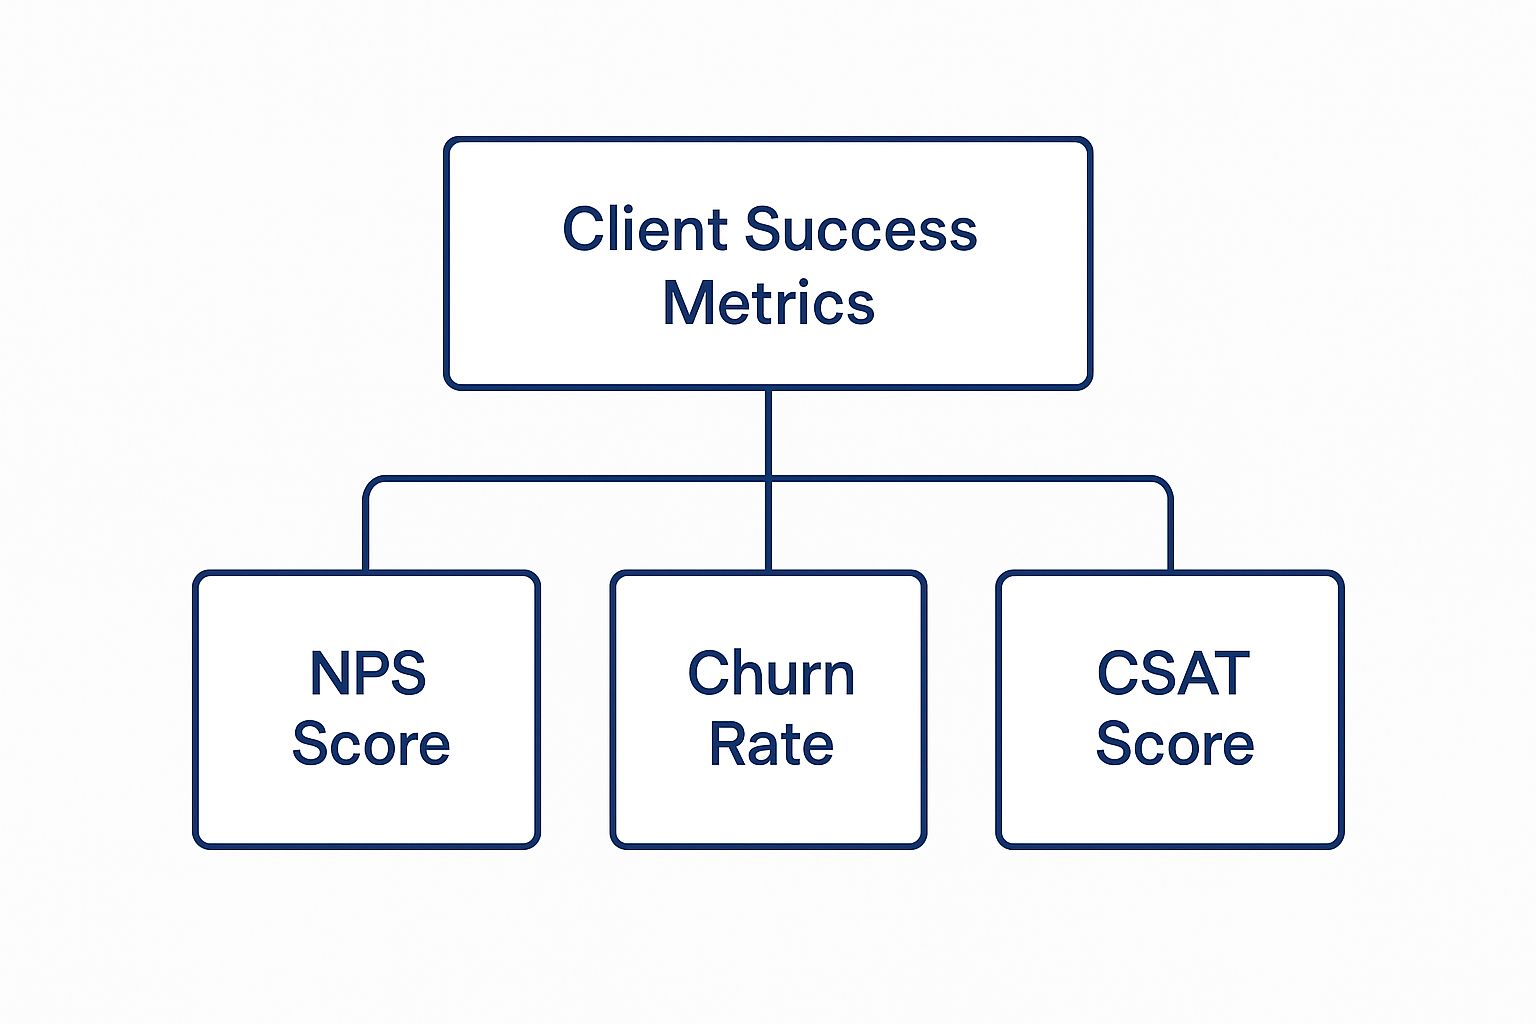
As you can see, metrics like NPS, CSAT, and Churn Rate aren't just random numbers; they are distinct signals that, when viewed together, paint a clear picture of the health of your customer relationships.
Important metrics in this pillar include:
- Churn Rate: The percentage of customers who leave over a specific period. It's the ultimate, undeniable sign that something went wrong.
- Net Promoter Score (NPS): This classic metric gauges long-term loyalty by asking one simple question: "How likely are you to recommend us?" It helps you separate your biggest fans from those who are at risk of leaving.
- Customer Satisfaction (CSAT): Perfect for measuring short-term happiness after a specific interaction, like a support call or an onboarding session. It gives you immediate feedback on key touchpoints.
Pillar 3: Financial Outcomes
This final pillar is what gets the attention of your CFO and board members. It directly connects all your team's hard work to the company's bottom line. This is how you prove the ROI of your client success program and show that it's a strategic driver of the business, not just a cost center.
Financial outcome metrics are the ultimate proof of success. They show that happy, engaged customers aren't just a feel-good story—they are your company's most powerful engine for growth.
The essential financial metrics to track are:
- Customer Lifetime Value (CLV): This forecasts the total revenue you can expect to earn from a single customer over the entire course of their relationship with you. A rising CLV is a fantastic sign.
- Net Revenue Retention (NRR): This is a huge one for SaaS. It measures the percentage of recurring revenue you've retained from your existing customers, factoring in both upgrades and downgrades. An NRR over 100% is the gold standard—it means your existing customer base is actually growing in value, which is the secret to sustainable growth.
How to Build a Powerful Customer Health Score

While individual client success metrics give you a solid framework, a Customer Health Score is what pulls them all together into a single, predictive superpower. I like to think of it as a credit score for your customers; it’s one number that instantly tells you who's thriving, who's struggling, and who needs your attention right now.
A well-crafted Customer Health Score is a game-changer. It’s what lets you shift from putting out fires to preventing them in the first place, flagging churn risks before they become critical and shining a spotlight on your best upsell opportunities. This score is a key metric that blends everything from product usage and the value a customer gets to their overall business impact.
The best part is that modern tools, often powered by AI, can help you pinpoint issues and craft strategies to get customers more engaged. If you want to see how this fits into the bigger picture, you can check out some of the top customer success KPIs at Bitrix24.com.
Define Your "Healthy" Customer
First things first: what does a "healthy" customer actually look like for your business? This isn't a one-size-fits-all definition. It’s entirely unique to the specific value your product delivers.
Start by asking some tough questions. If you're running a project management tool, a healthy user might be someone who:
- Logs in at least four times a week.
- Has created more than 10 projects.
- Regularly invites new team members.
But for an accounting software, that definition would be totally different. Health might be measured by how many invoices are sent or reports are generated. The goal is to identify the real-world behaviors that directly lead to long-term retention and happy customers.
Select and Weight Your Metrics
Once you know what health looks like, you can pick the metrics that actually paint that picture. Don't fall into the trap of tracking everything—just choose a handful of the most impactful ones.
For a typical SaaS company, a great starting point might look something like this:
- Product Adoption: Are they using your stickiest features? (40% weight)
- Login Frequency: How often are they in the platform? (30% weight)
- Support Tickets: Is their ticket volume unusually high or low? (15% weight)
- Recent NPS Score: Are they a Promoter or a Detractor? (15% weight)
The weighting here is crucial. Give more significance to the metrics you know are the strongest predictors of success. For instance, getting a customer to adopt a core feature is often a much stronger health signal than just seeing them log in.
Building a health score is less about complex math and more about understanding what actions truly create value for your clients. Start simple, gather data, and refine your weights over time as you learn what really drives positive outcomes.
Implement a Red, Yellow, Green System
Finally, you need a way to make this score instantly understandable for your entire team. The classic "Red, Yellow, Green" stoplight system is perfect for this. It translates a number into a clear, actionable signal.
- Green (Healthy): These are your champions. They’re deeply engaged, getting immense value, and are prime candidates for case studies or upsell conversations.
- Yellow (At Risk): These customers are waving a few small red flags. Maybe their usage has dipped or they left a lukewarm survey response. They need proactive outreach from your success team to get ahead of any problems.
- Red (Critical): These accounts are in immediate danger of churning. They require urgent, high-touch intervention to figure out what's wrong and get them back on track.
This simple visual system makes prioritizing your team's efforts a breeze, ensuring you focus your energy where it’ll have the biggest impact. By creating this score, you're not just tracking data; you're building an early-warning system that protects your revenue. Improving these health scores is directly linked to boosting key customer retention metrics.
Using AI to Predict and Prevent Churn

While a Customer Health Score gives you a powerful snapshot, Artificial Intelligence (AI) takes your analysis to a whole other level. Think of AI as your team’s most vigilant analyst, working 24/7 to spot patterns that are nearly invisible to the human eye. It moves beyond simple client success metrics to uncover the subtle, complex behaviors that signal a customer is quietly drifting away.
This is where proactive churn prevention truly comes to life. AI platforms can sift through enormous streams of data—login times, feature usage, support ticket sentiment, and even mouse movements—to identify accounts that fit a high-risk profile, long before they ever appear on a "Red" list.
Turning Predictive Insights Into Action
Detecting a problem is only half the battle; acting on it is what really matters. This is where AI’s role expands from analyst to co-pilot for your Client Success Managers (CSMs). Instead of just flagging an at-risk account, modern AI can actually automate the initial outreach.
This automation can take several forms:
- Smart Nudges: An account showing declining engagement might automatically receive an email highlighting a new feature relevant to their past activity.
- Proactive Help: If a user repeatedly stumbles in a specific workflow, an in-app message could pop up with a link to a helpful tutorial or a short video guide.
- Intelligent Escalation: For high-value accounts showing multiple risk signals, AI can create a task for a CSM with a full summary, ensuring a human touch is applied exactly where it's needed most.
By handling these initial, data-driven interventions, AI gives your CSMs their most valuable resource back: time. This allows them to focus on building strategic relationships and solving complex problems, not just chasing down low-level alerts.
AI-powered tools are becoming a key differentiator, enabling real-time churn prediction by analyzing usage patterns. Better yet, by automating repetitive tasks, they free up CSMs to focus on high-value, strategic interactions. As detailed in a report from the Technology & Services Industry Association, this leads to better personalization and improved customer outcomes.
Ultimately, weaving AI into your client success strategy makes your entire operation more intelligent and scalable. It’s not about replacing your team; it's about amplifying their expertise. To learn more about applying these strategies effectively, check out our complete guide on how to reduce customer churn and turn these powerful insights into lasting retention.
Common Mistakes in Tracking Client Metrics
Having access to data is one thing; using it correctly is another challenge entirely. So many well-intentioned teams fall into common traps that make their client success metrics nearly useless, leading to wasted effort and missed opportunities. If you know what to watch out for, you can build a smarter program that drives real results instead of just generating reports.
One of the most common errors is getting obsessed with vanity metrics. These are the flashy numbers that look great on a slide deck—like total sign-ups or website page views—but don't actually tell you anything about customer health or business success. For instance, a company might pop the champagne for hitting 100,000 registered users. But if only 5% of them are actually active, that big number is just hiding a massive engagement problem.
The most dangerous mistake is measuring things that are easy to count instead of things that truly count. Actionable metrics might feel less glamorous, but they provide the real insights you need for growth.
Instead, zero in on metrics directly tied to the value your customers receive. Think feature adoption rates, task completion rates, or the time it takes for a new user to get their first "win" with your product.
Focusing on Data Instead of People
Another huge misstep is looking at your customer base as one giant, uniform group. When you don't segment your data by customer type, size, or where they are in their journey, you miss the crucial context behind the numbers. A high churn rate is always concerning, but knowing that 90% of that churn comes from small businesses on your cheapest plan tells a very different story than if it came from your high-value enterprise accounts.
The same goes for a metric like Net Promoter Score (NPS). An average score of +40 might seem perfectly healthy on the surface. But what if you dug a little deeper? Segmentation could reveal that your oldest, most loyal customers are now Detractors, while all your Promoters are brand new sign-ups. You've just uncovered a critical retention risk that would have otherwise been completely invisible.
To sidestep this, always slice your key metrics across meaningful segments:
- By Customer Tier: Enterprise vs. SMB
- By Lifecycle Stage: Onboarding vs. Mature vs. At-Risk
- By User Persona: Admin vs. End-User
Suffering from Analysis Paralysis
Finally, it's easy to fall into the "more is better" trap, trying to track every metric under the sun. This is a fast track to analysis paralysis, where you’re so buried in data that you can’t make a clear decision or take any meaningful action. Your dashboard becomes a cluttered mess of charts that nobody really understands or acts upon.
The solution? Be ruthless with your priorities. Start with a small, core set of metrics tied directly to your main business goals—like the ones we covered in the pillars of engagement, retention, and financial health. Once you have a firm grip on those and are consistently acting on the insights they provide, then you can think about adding more. Managing all this becomes much simpler with the right tools; in fact, smart customer success automation can help filter out the noise and bring only the most critical signals to your attention.
By sidestepping these common mistakes—vanity metrics, a lack of segmentation, and data overload—you can turn client metric tracking from a passive reporting exercise into a powerful engine for proactive, sustainable growth.
Answering Your Top Questions About Client Success Metrics

Once you start thinking about tracking client success, the practical questions start piling up. It's one thing to understand the concepts, but another to put them into practice. Let’s tackle some of the most common questions I hear from teams just getting started.
How Often Should We Review Our Client Success Metrics?
There's no one-size-fits-all answer here. The right review cadence really depends on the metric you're looking at. Trying to review everything at the same pace is a recipe for either burnout or missing critical signals.
A good way to think about it is by splitting them into two groups: leading and lagging indicators.
- Leading Indicators: These are your early-warning systems. Think product usage, login frequency, and feature adoption. You'll want to keep a constant eye on these, often with real-time or daily dashboards. A quick weekly huddle to discuss any surprising trends is a fantastic habit to build.
- Lagging Indicators: These metrics show the results of your past efforts. Things like Net Promoter Score (NPS), churn rate, and Customer Lifetime Value (CLV) take time to move. A monthly or quarterly review makes more sense here, as it gives you enough data to spot meaningful, long-term trends.
This two-speed approach helps you stay nimble day-to-day while also making smart, strategic decisions for the long haul.
What's the Best Starting Metric for a New SaaS Company?
If you're an early-stage SaaS company and can only focus on one thing, make it Product Adoption Rate. This metric tells you if new customers are actually using the core, sticky features that solve their biggest problems.
Why is this so vital at the beginning? Because high adoption is one of the strongest signs that your customers are getting real value. It validates that your product is solving a genuine pain point for your first users. Nailing this ensures you have a solid product foundation before you pour money into scaling sales and marketing. Get this right, and retention and revenue will naturally follow.
If customers don't adopt the key features that deliver on your promise, they will never become champions for your brand. Master adoption first, and other metrics like NPS and NRR will take care of themselves.
How Do I Show the ROI of Client Success Efforts?
Getting budget and buy-in for your client success program means you have to speak the language of the business: revenue. To prove the return on your investment (ROI), you need to connect your team's work directly to the company's financial health.
Focus on the metrics that leadership can't ignore:
- Net Revenue Retention (NRR): This is your trump card. An NRR over 100% is undeniable proof that your existing customer base is not just staying, but growing. It shows that your work is a direct engine for company growth through upsells and expansion.
- Customer Lifetime Value (CLV): Demonstrate how your team’s proactive support and better onboarding directly increase the total revenue you can expect from each customer over their entire relationship with you.
- Reduced Churn Rate: Every customer you save is revenue you've protected. Don't just report the rate; calculate the actual dollar value of the churn your team prevented.
When you talk to leadership, create reports that draw a clear line from your high Customer Health Scores or strong NPS results to an increase in NRR and CLV. This makes the financial impact of your work impossible to miss.
What Are the Best Tools for Tracking These Metrics?
The right tech stack really depends on your company's size and stage.
For startups and smaller businesses, you can absolutely get by with the tools you probably already have. A smart combination of your CRM (like HubSpot), a survey tool (like Typeform), and a product analytics platform (like Mixpanel) can give you a pretty good picture.
As you scale, though, juggling all that data becomes a headache. This is where dedicated Customer Success Platforms (CSPs) become a game-changer. Tools like Gainsight, Catalyst, or ChurnZero are built specifically to pull all your customer data into one place. They give you a unified view, allowing for sophisticated health scoring, automated playbooks, and the complete picture your team needs to manage a growing client base effectively.
Worknet.ai transforms how you engage with users throughout their entire journey. Our AI-powered chat proactively guides visitors, converts trial users into paid customers, and provides continuous support to boost retention. We ensure you convert more visitors, close more trials, and grow lifetime value. Discover how a unified chat experience can drive your client success by visiting https://worknet.ai.
FAQs
.png)
Lorem ipsum dolor sit amet, consectetur adipiscing elit. Suspendisse varius enim in eros elementum tristique. Duis cursus, mi quis viverra ornare, eros dolor interdum nulla, ut commodo diam libero vitae erat. Aenean faucibus nibh et justo cursus id rutrum lorem imperdiet. Nunc ut sem vitae risus tristique posuere.
Lorem ipsum dolor sit amet, consectetur adipiscing elit. Suspendisse varius enim in eros elementum tristique. Duis cursus, mi quis viverra ornare, eros dolor interdum nulla, ut commodo diam libero vitae erat. Aenean faucibus nibh et justo cursus id rutrum lorem imperdiet. Nunc ut sem vitae risus tristique posuere.
Lorem ipsum dolor sit amet, consectetur adipiscing elit. Suspendisse varius enim in eros elementum tristique. Duis cursus, mi quis viverra ornare, eros dolor interdum nulla, ut commodo diam libero vitae erat. Aenean faucibus nibh et justo cursus id rutrum lorem imperdiet. Nunc ut sem vitae risus tristique posuere.
Lorem ipsum dolor sit amet, consectetur adipiscing elit. Suspendisse varius enim in eros elementum tristique. Duis cursus, mi quis viverra ornare, eros dolor interdum nulla, ut commodo diam libero vitae erat. Aenean faucibus nibh et justo cursus id rutrum lorem imperdiet. Nunc ut sem vitae risus tristique posuere.
Lorem ipsum dolor sit amet, consectetur adipiscing elit. Suspendisse varius enim in eros elementum tristique. Duis cursus, mi quis viverra ornare, eros dolor interdum nulla, ut commodo diam libero vitae erat. Aenean faucibus nibh et justo cursus id rutrum lorem imperdiet. Nunc ut sem vitae risus tristique posuere.
Lorem ipsum dolor sit amet, consectetur adipiscing elit. Suspendisse varius enim in eros elementum tristique. Duis cursus, mi quis viverra ornare, eros dolor interdum nulla, ut commodo diam libero vitae erat. Aenean faucibus nibh et justo cursus id rutrum lorem imperdiet. Nunc ut sem vitae risus tristique posuere.
Lorem ipsum dolor sit amet, consectetur adipiscing elit. Suspendisse varius enim in eros elementum tristique. Duis cursus, mi quis viverra ornare, eros dolor interdum nulla, ut commodo diam libero vitae erat. Aenean faucibus nibh et justo cursus id rutrum lorem imperdiet. Nunc ut sem vitae risus tristique posuere.
Lorem ipsum dolor sit amet, consectetur adipiscing elit. Suspendisse varius enim in eros elementum tristique. Duis cursus, mi quis viverra ornare, eros dolor interdum nulla, ut commodo diam libero vitae erat. Aenean faucibus nibh et justo cursus id rutrum lorem imperdiet. Nunc ut sem vitae risus tristique posuere.
Lorem ipsum dolor sit amet, consectetur adipiscing elit. Suspendisse varius enim in eros elementum tristique. Duis cursus, mi quis viverra ornare, eros dolor interdum nulla, ut commodo diam libero vitae erat. Aenean faucibus nibh et justo cursus id rutrum lorem imperdiet. Nunc ut sem vitae risus tristique posuere.
Lorem ipsum dolor sit amet, consectetur adipiscing elit. Suspendisse varius enim in eros elementum tristique. Duis cursus, mi quis viverra ornare, eros dolor interdum nulla, ut commodo diam libero vitae erat. Aenean faucibus nibh et justo cursus id rutrum lorem imperdiet. Nunc ut sem vitae risus tristique posuere.

.webp)
.webp)
.webp)


