7 Essential Customer Success KPIs to Track for Sustainable Growth
In today's competitive SaaS landscape, keeping customers happy is just the starting point. True growth comes from understanding their journey, predicting their needs, and proving your value—a task impossible without the right data. This guide moves beyond vanity metrics to reveal the essential customer success KPIs that provide a clear, actionable view of your business's health. By tracking these key indicators, you can transform your customer success team from a reactive support function into a proactive revenue engine.
We'll explore not just what to measure, but how each KPI tells a unique story about your customer relationships. You will learn how to implement and interpret critical metrics like Churn Rate, Net Promoter Score (NPS), Customer Health Score, and more. Each section provides practical definitions, industry benchmarks, and implementation tips to help you get started.
Ultimately, mastering these customer success KPIs enables you to reduce churn, drive expansion, and build a loyal user base that advocates for your brand. Let's dive into the metrics that will help you move from simply satisfying customers to ensuring their long-term success with your product.
1. Customer Churn Rate
Customer Churn Rate is one of the most fundamental customer success KPIs, measuring the percentage of customers who stop doing business with you over a specific period. It is the direct inverse of customer retention and provides a clear, high-level view of your company's ability to hold onto its customer base. A high churn rate can signal critical issues with your product, customer service, or overall value proposition.
Calculating churn is straightforward: divide the number of customers lost during a period by the total number of customers at the beginning of that period, then multiply by 100 to get a percentage. For example, if you start the month with 500 customers and lose 25, your monthly churn rate is 5%. This metric is essential for forecasting revenue, assessing business health, and identifying areas for improvement.
Why It's a Critical KPI
Churn directly impacts revenue and growth potential. Acquiring a new customer is significantly more expensive than retaining an existing one, making churn reduction a highly efficient growth lever. Companies like Salesforce and Spotify rely on churn analysis to pinpoint at-risk customer segments and trigger proactive retention campaigns, such as offering personalized support or targeted discounts.
The bar chart below illustrates typical monthly churn rate benchmarks across different industries, highlighting how expectations can vary.
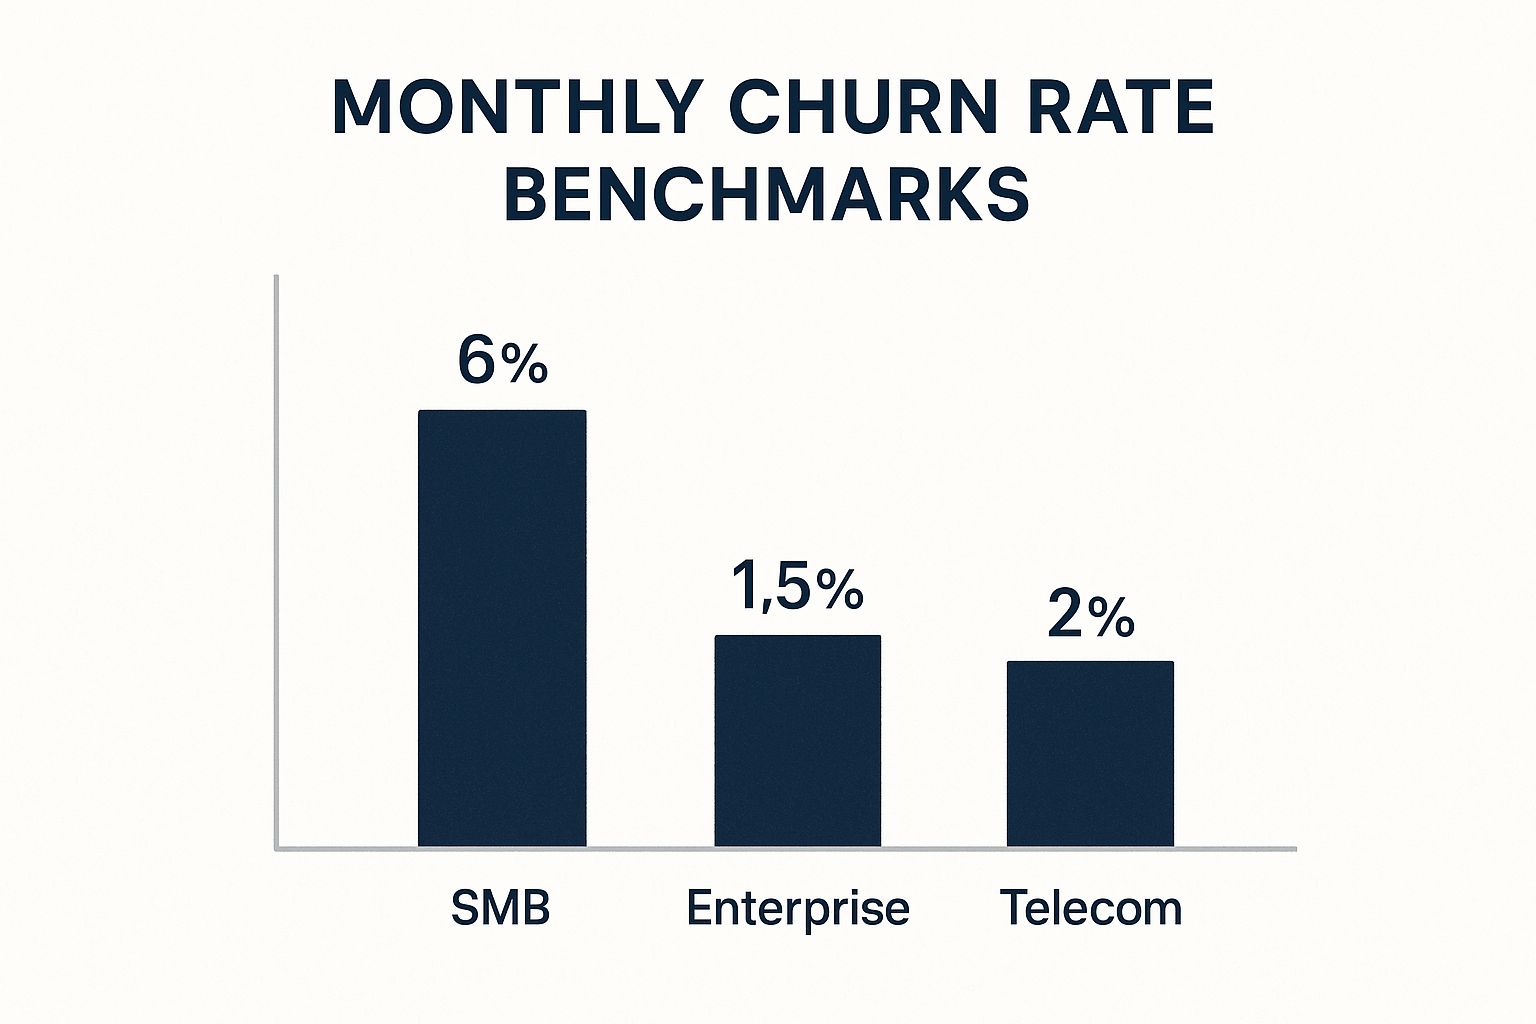
As the chart shows, churn rates for SMB-focused businesses are often higher than for enterprise clients, who have greater switching costs and deeper integrations.
How to Implement and Act on Churn Rate
To make this KPI actionable, go beyond a single, company-wide number.
- Segment Your Churn: Analyze churn by customer cohort (e.g., acquisition date, plan type, or industry). This helps identify patterns, such as a specific feature causing new users to leave.
- Differentiate Churn Types: Calculate both gross churn (total revenue lost) and net revenue churn (revenue lost minus expansion revenue from existing customers). A low or even negative net churn indicates that your upgrades and cross-sells are outpacing lost revenue.
- Set Up Automated Alerts: Use your CRM or customer success platform to create alerts that notify your team when churn exceeds a predefined threshold, allowing for rapid intervention.
By closely monitoring and segmenting your churn rate, you can transform it from a reactive indicator into a predictive tool for sustainable growth. For a deeper dive into strategies, you can learn more about how to reduce customer churn on worknet.ai.
2. Net Promoter Score (NPS)
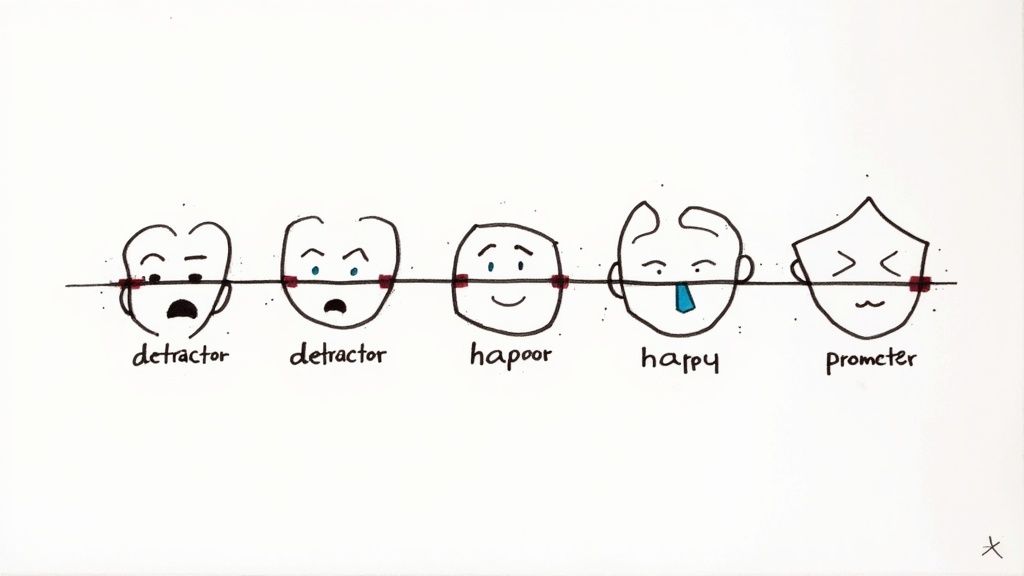
Net Promoter Score (NPS) is a widely adopted customer loyalty and satisfaction metric. It measures how likely your customers are to recommend your product or service to a friend or colleague. This simple yet powerful KPI is based on a single question: "On a scale of 0-10, how likely are you to recommend us?" Based on their response, customers are categorized as Promoters (9-10), Passives (7-8), or Detractors (0-6).
The final score is calculated by subtracting the percentage of Detractors from the percentage of Promoters, resulting in a number that can range from -100 to +100. This score provides a quick snapshot of customer sentiment and is a key indicator of potential growth and churn risk among customer success KPIs.
Why It's a Critical KPI
NPS provides a standardized benchmark for customer loyalty that is easy for the entire organization to understand and rally behind. It correlates strongly with business growth because Promoters are not just retained customers; they are active advocates who drive referrals and positive word-of-mouth. Companies with world-class loyalty, like Apple (NPS consistently above 70) and Tesla (which once reported a score of 96), leverage this feedback to maintain a significant competitive advantage.
Tracking NPS helps you identify underlying issues that create Detractors and uncover the "wow" factors that create Promoters. It's more than a score; it’s a system for operationalizing customer feedback to drive improvements across product, service, and overall experience.
How to Implement and Act on NPS
To get the most value from your NPS program, you must go beyond simply collecting scores.
- Follow Up with "Why?": Always ask an open-ended follow-up question, such as "What is the primary reason for your score?" The qualitative feedback is where the most actionable insights are found.
- Segment Your Data: Analyze NPS by customer segment, plan type, user role, or journey stage. This helps you pinpoint specific areas of friction or delight within your customer base.
- Close the Loop: Implement a process to respond to feedback. Thank Promoters for their support, engage Passives to understand what it would take to delight them, and immediately contact Detractors to resolve their issues and prevent churn.
- Focus on Trends: Instead of obsessing over a single score, track your NPS trend over time. A consistently improving score indicates that your customer-centric initiatives are working effectively.
By systematically collecting, analyzing, and acting on NPS feedback, you can turn this metric into a powerful engine for improving customer loyalty and driving long-term growth.
3. Customer Health Score
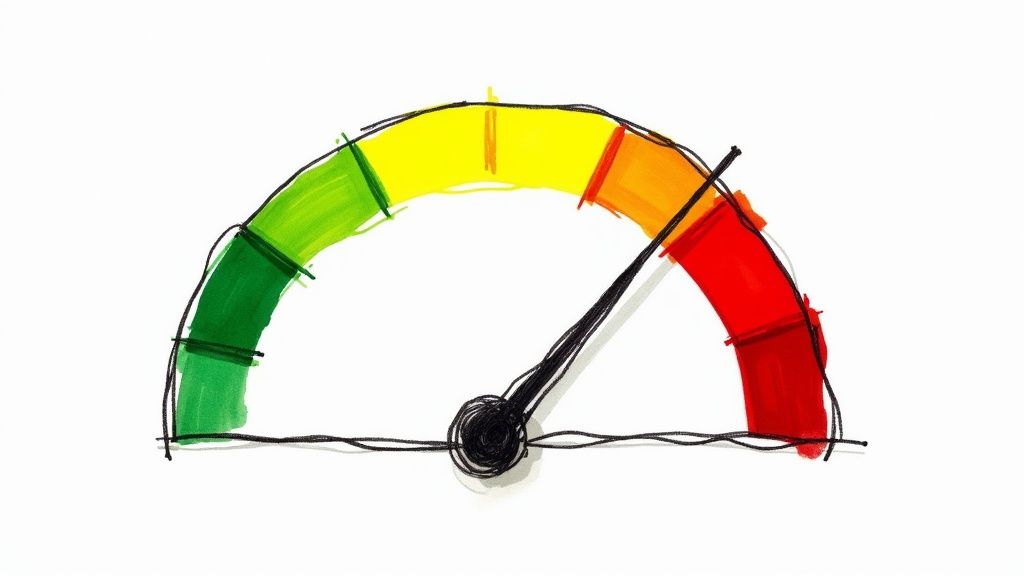
A Customer Health Score is a predictive metric that combines multiple data points to evaluate a customer's overall well-being and likelihood of churn or growth. Instead of relying on a single lagging indicator, it creates a composite score from factors like product usage, support ticket volume, survey responses, and contract details. This provides a holistic, proactive view of the customer relationship.
Calculating a health score involves assigning weights to different inputs to produce a single, easily digestible number or rating (e.g., a score out of 100 or a red/yellow/green status). For instance, high feature adoption and consistent logins might contribute positively, while an increase in support tickets could detract from the score. This KPI is crucial for prioritizing customer success efforts and identifying at-risk accounts before they churn.
Why It's a Critical KPI
The Customer Health Score transforms customer success from a reactive to a proactive function. It enables teams to identify subtle warning signs and opportunities that might otherwise be missed. Companies like Gainsight and HubSpot use these scores to trigger automated workflows, such as assigning a task to a Customer Success Manager (CSM) when a score drops below a certain threshold or sending an upsell offer when a score is consistently high.
By quantifying customer health, you can allocate resources more effectively, focusing your team's attention on the accounts that need it most. This data-driven approach allows for more personalized and timely interventions, directly impacting retention and expansion revenue. It serves as a leading indicator of future churn or loyalty, making it one of the most powerful tools in a CSM's arsenal.
How to Implement and Act on Customer Health Score
An effective health score is tailored to your specific business and customer journey.
- Start Simple and Iterate: Begin with 3-5 key indicators that strongly correlate with retention, such as product login frequency, adoption of key features, and recent support satisfaction scores. You can add more complexity over time.
- Weight Metrics Appropriately: Not all data points are created equal. Analyze historical data to determine which factors are most predictive of positive or negative outcomes, and assign weights accordingly. For example, completing onboarding might be weighted more heavily than simply logging in.
- Combine Qualitative and Quantitative Data: A robust score includes both hard data (e.g., usage metrics) and relationship health factors (e.g., CSM sentiment, survey feedback). This ensures you capture the full picture of the customer relationship.
- Validate and Refine Regularly: Continuously test your health score's accuracy by comparing it to actual outcomes like churn and renewal rates. Adjust the formula and weightings as your product and customer base evolve.
4. Customer Lifetime Value (CLV)
Customer Lifetime Value (CLV) is a predictive metric that represents the total revenue a business can reasonably expect from a single customer account throughout their entire relationship. It moves beyond short-term metrics like purchase value to forecast long-term profitability, making it one of the most strategic customer success KPIs. A high CLV indicates strong customer loyalty, product satisfaction, and a healthy business model.
Calculating CLV involves multiplying the average purchase value by the average purchase frequency and the average customer lifespan. For example, if a customer spends $100 per month and stays for 36 months, their CLV is $3,600. This metric is crucial for making informed decisions about marketing spend, customer acquisition costs, and retention investments.
Why It's a Critical KPI
CLV provides a clear financial justification for investing in customer success. It shifts the company's focus from acquiring many low-value customers to retaining and nurturing high-value ones. Companies known for exceptional customer experiences, like Starbucks, reportedly have a CLV of over $14,000, demonstrating the power of loyalty. Similarly, Adobe's shift to a subscription model was driven by the goal of increasing CLV by building longer, more predictable customer relationships.
Understanding CLV allows you to determine how much you can afford to spend to acquire a new customer (Customer Acquisition Cost or CAC). A healthy business model typically has a CLV-to-CAC ratio of 3:1 or higher, ensuring profitability over the long term.
How to Implement and Act on CLV
To transform CLV from a simple metric into an actionable strategy, you need to segment and contextualize your calculations.
- Segment Your CLV: Don't rely on a single, company-wide CLV. Calculate it for different customer segments, such as by acquisition channel, subscription plan, or industry. This reveals which customer types are most profitable and deserve the most attention.
- Include Expansion Revenue: A basic CLV calculation can be misleading. Ensure your model accounts for upsells, cross-sells, and other forms of expansion revenue, as this is a key driver of lifetime value in SaaS and subscription businesses.
- Use Cohort Analysis: Group customers by their sign-up date (cohorts) and track their CLV over time. This helps you understand how product changes, marketing campaigns, or pricing adjustments impact long-term customer value.
By actively monitoring and working to improve CLV, your customer success team can directly demonstrate its impact on the company's bottom line. For a more detailed guide, you can learn more about how to increase customer lifetime value on worknet.ai.
5. Product Adoption Rate
Product Adoption Rate measures how deeply and effectively new and existing customers are engaging with your product's key features. It goes beyond simple usage, tracking the journey from initial sign-up to becoming a proficient, habitual user. A high adoption rate is a strong indicator that customers are realizing the intended value of your product, which is a cornerstone of long-term retention and one of the most vital customer success KPIs.
Calculating this KPI involves defining key "activation" events or features and then tracking the percentage of users who engage with them over time. For example, if a key feature is used by 200 out of 1,000 active users, the adoption rate for that feature is 20%. This metric helps you understand not just if customers are using your product, but how they are using it.
Why It's a Critical KPI
Low product adoption is a leading indicator of future churn. If customers aren’t using the features designed to solve their problems, they will eventually stop seeing value and look for alternatives. Companies that excel at product-led growth, like Slack and Calendly, are masters at monitoring and driving adoption. Slack, for instance, famously identified that teams sending over 2,000 messages had a 93% retention rate, making message volume a key adoption metric to drive.
By tracking adoption, customer success teams can proactively identify accounts that are struggling and intervene with targeted training, resources, or support. This transforms the customer relationship from reactive problem-solving to proactive value delivery, ensuring customers achieve their desired outcomes.
How to Implement and Act on Product Adoption Rate
To effectively leverage this KPI, you must move from a general overview to specific, actionable insights.
- Define Adoption Milestones: Map out the ideal customer journey and identify key actions or features a user should engage with at different stages (e.g., within the first week, first month). These milestones should align with moments of value realization.
- Segment Adoption Data: Don't just look at the overall rate. Analyze adoption by user persona, company size, or subscription plan. You might find that enterprise users are ignoring a feature that small businesses love, revealing a need for different onboarding tracks.
- Identify and Address Barriers: Use low adoption rates for specific features as a diagnostic tool. Is the feature hard to find? Is the UI confusing? Is there a lack of awareness? Conduct user surveys or interviews with low-adoption segments to uncover the "why" behind the data.
- Trigger Targeted Campaigns: Create automated email sequences or in-app guides for users who haven't adopted a critical feature after a certain period. This nudges them toward discovering more value in your product.
Monitoring Product Adoption Rate allows your team to ensure customers are not just paying for your software, but are actively integrating it into their workflows. For a more detailed guide, you can learn more about how to improve product adoption at worknet.ai.
6. Customer Effort Score (CES)
Customer Effort Score (CES) is a transactional metric that measures how much effort a customer has to exert to get an issue resolved, a request fulfilled, or a question answered. It pinpoints friction in the customer journey, operating on the principle that loyalty is driven more by making things easy for customers than by delighting them. A low-effort experience is a strong predictor of repeat business and positive word-of-mouth.
The score is typically gathered by asking a single question after a specific interaction: "To what extent do you agree with the following statement: The company made it easy for me to handle my issue?" Customers respond on a scale, often from 1 (Strongly Disagree) to 7 (Strongly Agree). This KPI is a crucial part of any customer success kpis toolkit because it directly links operational performance to customer loyalty.
Why It's a Critical KPI
Low effort is a powerful driver of customer retention. The research popularized by Gartner found that 96% of customers with a high-effort service interaction become more disloyal, compared to just 9% of those with a low-effort experience. Companies like Amazon have built their entire empires on this concept, optimizing for one-click purchasing to minimize effort. Similarly, Zappos analyzes the effort involved in its famously liberal return process to ensure it remains a point of strength, not friction.
Focusing on CES helps teams move beyond simply closing tickets to actually solving problems efficiently. It shifts the focus from speed to effectiveness, ensuring the customer's issue is resolved on the first contact without needing follow-ups or channel switching. This efficiency not only boosts customer loyalty but also reduces operational costs for the support team.
How to Implement and Act on CES
To effectively leverage CES, you must integrate it at key moments in the customer journey.
- Deploy Surveys Immediately: Trigger a CES survey right after a support ticket is closed, a knowledge base article is used, or a purchase is completed. The feedback is most accurate when the experience is fresh.
- Focus on High-Effort Touchpoints: Don't just calculate an average score. Segment your CES data by interaction type (e.g., billing inquiry, technical support) to identify which processes are causing the most customer friction. Prioritize improving these areas first.
- Combine with Qualitative Feedback: Always include an optional open-ended question like, "How could we have made it easier for you?" This qualitative data is gold, providing the specific context you need to understand why the effort was high and how to fix the root cause.
- Segment for Deeper Insights: Analyze CES scores by customer segment, product line, or support agent. This can reveal if a certain demographic finds a process difficult or if a particular agent needs more training.
7. Revenue Expansion Rate
Revenue Expansion Rate is a powerful customer success KPI that measures the additional revenue generated from your existing customer base. It tracks growth from upsells, cross-sells, add-ons, and plan upgrades over a specific period. This metric, often discussed as Net Revenue Retention (NRR), reveals if you are growing revenue from your current customers faster than you are losing it from churn and downgrades.
To calculate this, you measure the new monthly recurring revenue (MRR) from expansion and divide it by the MRR at the start of the period, then multiply by 100. For instance, if you start the month with $100,000 in MRR and generate an additional $10,000 from existing customer upgrades, your revenue expansion rate is 10%. It showcases your ability to deliver increasing value over time.
Why It's a Critical KPI
Revenue expansion is the engine of efficient, sustainable growth. It proves that your product is becoming more integral to your customers' operations, creating a natural growth loop without the high cost of new customer acquisition. SaaS leaders like Snowflake, which reported an incredible 168% net revenue retention in 2021, use this metric to demonstrate immense scalability and product stickiness to investors.
A high expansion rate indicates strong product-market fit and successful customer success engagement. It signals that customers are not just staying but are actively investing more into your solution, a clear sign of the value they receive. This makes it one of the most vital customer success KPIs for any subscription-based business.
How to Implement and Act on Revenue Expansion Rate
To leverage this KPI effectively, you must go beyond a single, company-wide figure.
- Track Gross vs. Net Expansion: Differentiate between gross expansion (all new revenue from existing customers) and net expansion (gross expansion minus revenue lost from churn and downgrades). This distinction clarifies whether new expansion is truly overcoming revenue loss.
- Segment by Customer Profile: Analyze expansion rates by customer size, industry, or plan type. You might discover that mid-market clients have the highest propensity to upgrade, allowing you to focus your upselling efforts.
- Identify Expansion Triggers: Pinpoint the actions or milestones that correlate with successful upgrades. Do customers who adopt a specific feature or attend a training webinar tend to expand their accounts? Use this data to create proactive upselling playbooks for your CS team.
- Align with Customer Success Milestones: Tie expansion opportunities directly to customer value realization. When a customer achieves a key outcome using your product, it's the perfect time for a CSM to introduce a premium feature that can help them achieve even more.
7 Key Customer Success KPIs Comparison
From Data to Action: Activating Your Customer Success KPIs
Navigating the landscape of customer success can feel like managing a complex ecosystem. We've explored seven critical customer success KPIs, from the foundational Customer Churn Rate and Customer Lifetime Value (CLV) to the more nuanced metrics like Customer Health Score and Product Adoption Rate. Each one serves as a vital sign, offering a distinct perspective on the well-being of your customer relationships. However, the true power of these metrics is not found in their individual values but in their collective story.
Viewing these KPIs in isolation is like trying to understand a novel by reading a single chapter. You get a piece of the story, but you miss the overarching plot and character development. The real transformation begins when you weave these data points together into a single, cohesive narrative that drives proactive, intelligent action. A low Net Promoter Score (NPS) is a warning, but a low NPS combined with a declining Product Adoption Rate signals an immediate and significant flight risk that requires a specific, targeted intervention.
Building a Proactive, KPI-Driven Engine
The goal is to transition from a reactive "report and review" culture to a proactive "predict and prevent" model. This means building systems that connect your customer success KPIs directly to your team’s daily workflows. Instead of manually cross-referencing spreadsheets, imagine a system where a specific combination of KPI triggers automatically initiates a strategic response.
For example, consider these trigger-based workflows:
- Action: Automatically create a high-priority task for their dedicated Customer Success Manager (CSM) to schedule a check-in call and review the support interaction.
- Action: Initiate an automated email sequence showcasing advanced features or a new premium tier, highlighting the value they are already receiving and what more they could achieve.
- Action: Enroll the primary users in a targeted onboarding drip campaign focused exclusively on the benefits and use cases of that specific feature.
From Measurement to Mastery
Ultimately, mastering your customer success KPIs isn't just about knowing your numbers; it's about understanding the "why" behind them and acting on those insights with precision and speed. It's about empowering your team with the data they need to move from being firefighters to strategic advisors. By integrating these metrics into a unified strategy, you build a powerful feedback loop that fuels continuous improvement across your product, marketing, and support functions.
This integrated approach transforms your data from a static report card into a dynamic playbook for growth. It allows you to anticipate needs, mitigate risks before they escalate, and identify expansion opportunities you might otherwise miss. In a competitive market, the companies that thrive will be those that not only measure customer success but activate it at every touchpoint. This data-driven, customer-centric philosophy is the cornerstone of building a resilient business with a loyal customer base that grows with you.
Ready to turn your customer success KPIs from passive metrics into proactive growth signals? Worknet.ai Inc helps you automate user engagement at critical moments, gathering real-time feedback and driving adoption to improve your key metrics. Discover how our AI-powered platform can help you build a smarter, more effective customer success strategy at Worknet.ai Inc.
FAQs
.png)
Lorem ipsum dolor sit amet, consectetur adipiscing elit. Suspendisse varius enim in eros elementum tristique. Duis cursus, mi quis viverra ornare, eros dolor interdum nulla, ut commodo diam libero vitae erat. Aenean faucibus nibh et justo cursus id rutrum lorem imperdiet. Nunc ut sem vitae risus tristique posuere.
Lorem ipsum dolor sit amet, consectetur adipiscing elit. Suspendisse varius enim in eros elementum tristique. Duis cursus, mi quis viverra ornare, eros dolor interdum nulla, ut commodo diam libero vitae erat. Aenean faucibus nibh et justo cursus id rutrum lorem imperdiet. Nunc ut sem vitae risus tristique posuere.
Lorem ipsum dolor sit amet, consectetur adipiscing elit. Suspendisse varius enim in eros elementum tristique. Duis cursus, mi quis viverra ornare, eros dolor interdum nulla, ut commodo diam libero vitae erat. Aenean faucibus nibh et justo cursus id rutrum lorem imperdiet. Nunc ut sem vitae risus tristique posuere.
Lorem ipsum dolor sit amet, consectetur adipiscing elit. Suspendisse varius enim in eros elementum tristique. Duis cursus, mi quis viverra ornare, eros dolor interdum nulla, ut commodo diam libero vitae erat. Aenean faucibus nibh et justo cursus id rutrum lorem imperdiet. Nunc ut sem vitae risus tristique posuere.
Lorem ipsum dolor sit amet, consectetur adipiscing elit. Suspendisse varius enim in eros elementum tristique. Duis cursus, mi quis viverra ornare, eros dolor interdum nulla, ut commodo diam libero vitae erat. Aenean faucibus nibh et justo cursus id rutrum lorem imperdiet. Nunc ut sem vitae risus tristique posuere.
Lorem ipsum dolor sit amet, consectetur adipiscing elit. Suspendisse varius enim in eros elementum tristique. Duis cursus, mi quis viverra ornare, eros dolor interdum nulla, ut commodo diam libero vitae erat. Aenean faucibus nibh et justo cursus id rutrum lorem imperdiet. Nunc ut sem vitae risus tristique posuere.
Lorem ipsum dolor sit amet, consectetur adipiscing elit. Suspendisse varius enim in eros elementum tristique. Duis cursus, mi quis viverra ornare, eros dolor interdum nulla, ut commodo diam libero vitae erat. Aenean faucibus nibh et justo cursus id rutrum lorem imperdiet. Nunc ut sem vitae risus tristique posuere.
Lorem ipsum dolor sit amet, consectetur adipiscing elit. Suspendisse varius enim in eros elementum tristique. Duis cursus, mi quis viverra ornare, eros dolor interdum nulla, ut commodo diam libero vitae erat. Aenean faucibus nibh et justo cursus id rutrum lorem imperdiet. Nunc ut sem vitae risus tristique posuere.
Lorem ipsum dolor sit amet, consectetur adipiscing elit. Suspendisse varius enim in eros elementum tristique. Duis cursus, mi quis viverra ornare, eros dolor interdum nulla, ut commodo diam libero vitae erat. Aenean faucibus nibh et justo cursus id rutrum lorem imperdiet. Nunc ut sem vitae risus tristique posuere.
Lorem ipsum dolor sit amet, consectetur adipiscing elit. Suspendisse varius enim in eros elementum tristique. Duis cursus, mi quis viverra ornare, eros dolor interdum nulla, ut commodo diam libero vitae erat. Aenean faucibus nibh et justo cursus id rutrum lorem imperdiet. Nunc ut sem vitae risus tristique posuere.
.webp)
.webp)
.webp)


