Mastering Customer Retention Metrics for Sustainable SaaS Growth
Customer retention metrics are the vital signs of your SaaS business. They go beyond simple statistics, offering a real-time health check on your customer relationships and pointing directly to your profitability and long-term viability.
Why Customer Retention Metrics Are Your Growth Engine
In the world of SaaS, it’s easy to get caught up in the thrill of the chase—landing new customers. Every new logo feels like a win. But what if the most powerful path to sustainable growth isn't about endlessly pouring new leads into the funnel? What if it's about making sure the customers you've already won decide to stay?
Think of your business like a bucket. Acquiring new customers is the water you pour in. That's essential. But customer churn—the customers who leave—is like having holes in that bucket. If you don't plug those leaks, you'll find yourself running faster and faster on the acquisition treadmill just to keep the water level from dropping.
Customer retention metrics are how you find and fix those leaks, turning a leaky bucket into a solid reservoir for genuine growth.
The Profitability of Loyalty
Shifting your focus to retention isn't just a defensive play; it’s one of the smartest, most profitable moves you can make. The numbers don't lie. Research has shown that a mere 5% increase in customer retention can rocket profits by 25% to 95%. You can dig deeper into these powerful retention statistics to see how they apply to your own strategy.
This isn't just about saving money on acquisition costs. It's about building a resilient business where existing customers become your most valuable asset, driving predictable revenue and organic growth through loyalty and advocacy.
Frankly, understanding these numbers is non-negotiable for building a healthy, profitable company. They give you the crucial insights needed to:
- Diagnose problems early: Spot negative trends in customer behavior before they turn into a full-blown crisis.
- Validate product-market fit: Get clear confirmation that your solution is delivering real, ongoing value.
- Fuel strategic decisions: Know exactly where to invest your time and resources for the biggest impact on customer happiness.
Ultimately, these metrics pull your focus away from short-term wins and toward long-term value creation. They set the stage for the specific KPIs we're about to explore, giving you a clear roadmap for what to track, starting today.
The 4 Foundational Customer Retention Metrics You Must Track
We've established that customer retention is the real engine behind sustainable growth. But how do you actually measure it? To get a real grip on retention, you have to move past gut feelings and start speaking its language. That means focusing on the four foundational customer retention metrics that truly tell the story of your customer relationships.
These numbers aren't just vanity metrics; they're the vital signs of your business. They show you how healthy your company is, how sticky your product has become, and how stable your revenue will be down the road.
This infographic gives you a quick visual breakdown of how the pros look at these numbers, turning raw data into smart business moves.
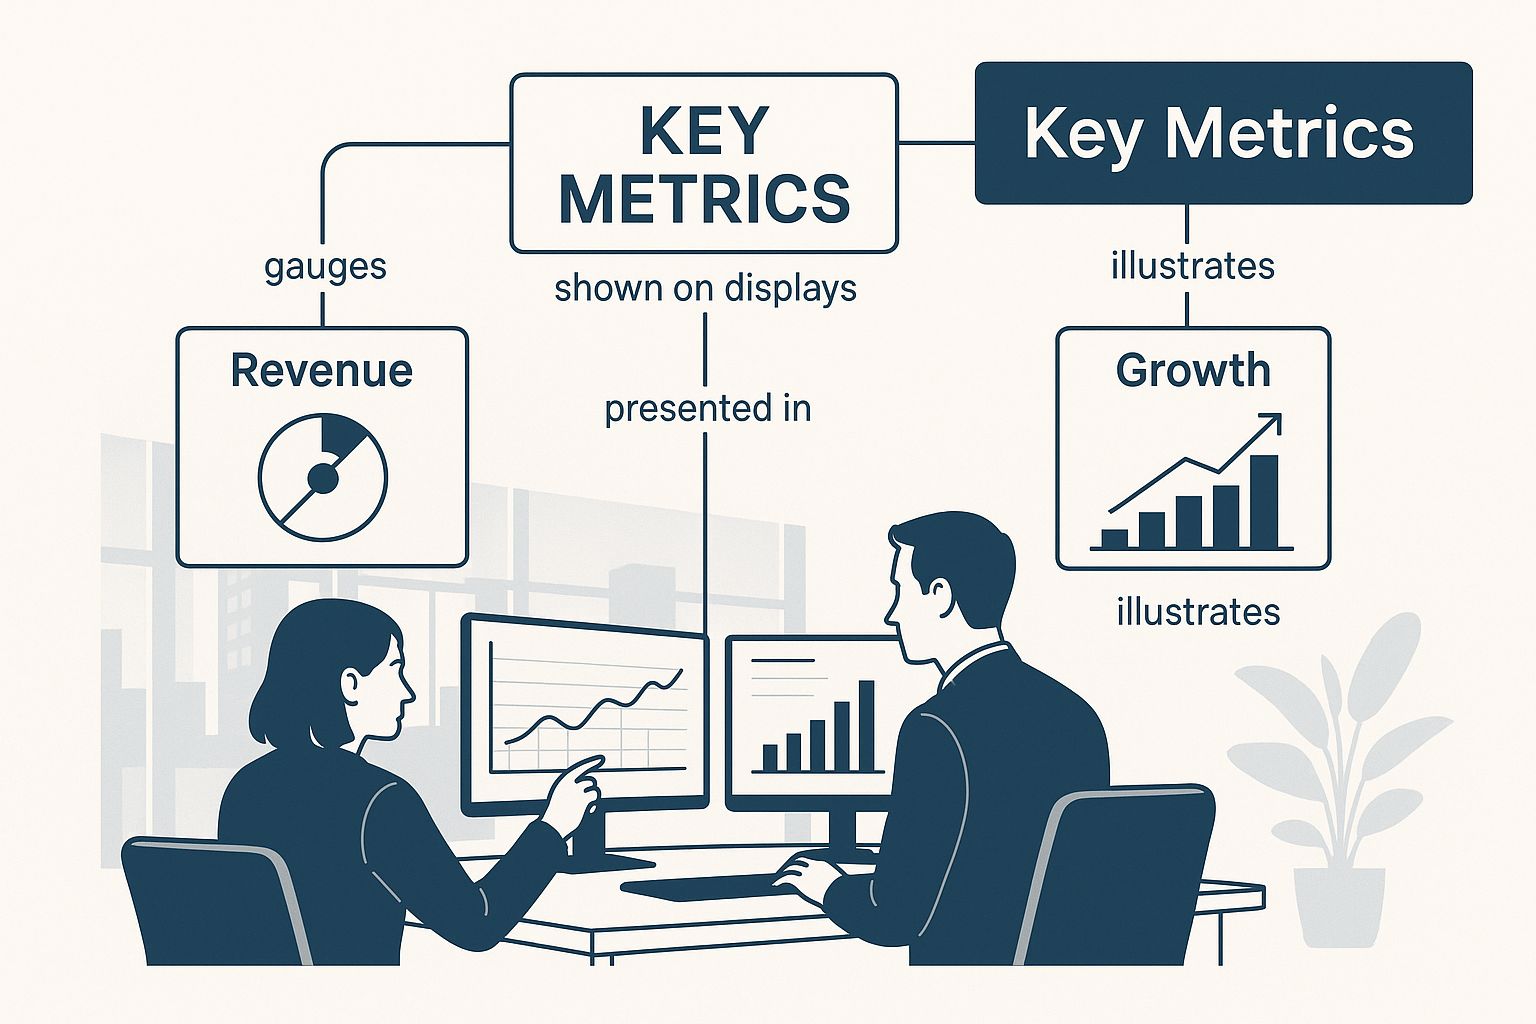
When you get these metrics up on a dashboard, your whole team can spot trends in an instant, figure out what’s going wrong, and make decisions that actually build loyalty.
1. Customer Retention Rate (CRR)
First up is the most direct measure of loyalty: Customer Retention Rate (CRR). It tells you exactly what percentage of your customers stuck around over a set period. It’s the ultimate proof that you’re delivering on your promises.
Think of it as the flip side of churn. Instead of obsessing over who left, you're celebrating who stayed. A high CRR is a powerful signal that you have a valuable, healthy product.
To calculate it, you just need three pieces of information for your chosen timeframe (like a quarter):
- Customers at the start of the period (S)
- Customers at the end of the period (E)
- New customers you gained during the period (N)
The formula is pretty straightforward: CRR = [ (E - N) / S ] x 100
For example, if you started with 1,000 customers, ended with 1,200, and brought in 300 new ones, your math would be [ (1200 - 300) / 1000 ] x 100. That gives you a solid 90% retention rate.
2. Customer Churn Rate
While CRR shows you your wins, Customer Churn Rate shines a light on your losses. It’s the percentage of customers who decided to leave your service over a specific period. It can be a tough number to look at, but it’s an absolutely critical diagnostic tool.
When you see your churn rate creeping up, it’s a massive red flag that something’s off. It could be a buggy feature, a frustrating customer service experience, or even a competitor making a splash. You have to jump on this proactively. To really get this under control, it's worth learning how to reduce customer churn with specific, targeted strategies.
The formula for customer churn is simple:
- Customers who churned in a period (C)
- Customers at the start of the period (S)
And the formula is: Churn Rate = ( C / S ) x 100
A high churn rate is like trying to fill a bucket with holes. It doesn't matter how much water you pour in through customer acquisition; you’ll always struggle to make progress. This metric forces you to focus on plugging the leaks first.
3. Revenue Churn
Let's be honest: not all churn is created equal. Losing five tiny accounts isn't the same as losing one massive enterprise client. This is where Revenue Churn becomes one of the most vital customer retention metrics you can possibly track. It measures the monetary value of the customers you've lost.
There are two flavors of revenue churn you need to know:
- Gross Revenue Churn: This is the total monthly recurring revenue (MRR) you lost from customers canceling or downgrading their plans in a given period.
- Net Revenue Churn: Now this is the magic number. It takes your gross revenue churn and then subtracts any new revenue you generated from your existing customers, like from upgrades or cross-sells.
If your Net Revenue Churn is negative, you’ve hit the SaaS jackpot. It means the expansion revenue from your happy, existing customers is more than making up for the revenue you're losing from churn. This is the holy grail known as negative churn.
4. Customer Lifetime Value (CLV)
Finally, we have Customer Lifetime Value (CLV). This metric projects the total amount of revenue you can reasonably expect to earn from a single customer over the entire time they do business with you. It fundamentally shifts your thinking from one-off transactions to long-term partnerships.
A high CLV tells you that your customers aren't just sticking around; they're becoming more valuable over time. This is the metric that justifies spending money on customer success and marketing because it makes the long-term payoff crystal clear. When you know your CLV, you can make much smarter decisions about how much you can afford to spend to acquire a new customer and still be profitable.
Setting Realistic Retention Benchmarks
So you're tracking your customer retention rate. That’s a great first step, but the number itself is pretty meaningless without any context.
A 90% retention rate might feel like a massive win, but what if it's actually below average for your industry? On the flip side, a 55% rate could feel like a total disaster when it's perfectly normal for your sector. To set goals that actually make sense, you first need to understand what's realistic.
Context is everything. Comparing your SaaS company's retention to a local retail business is like comparing apples and oranges. Every industry has its own unique customer behaviors, buying cycles, and expectations that directly shape what loyalty looks like.
Celebrating a retention rate that’s below your industry average is a false win, while panicking over normal fluctuations can lead to poor, reactive decisions. The key is to measure your performance against relevant standards, not abstract ideals.
Why Industry Benchmarks Differ
So, why do these benchmarks vary so much? It really boils down to one simple idea: switching costs. Think about it. A software company whose product is deeply woven into a client's daily operations has incredibly high switching costs. Leaving is a massive headache. Compare that to a local coffee shop where the "cost" of trying the place across the street is virtually zero. The more effort it takes for a customer to leave, the higher your retention will naturally be.
For example, industries like media and professional services often enjoy sky-high retention, with some reports showing rates around 84%. This isn't surprising, since these are typically subscription-based services or long-term advisory relationships. On the other end of the spectrum, you have industries like hospitality, travel, and restaurants, where rates hover closer to 55%. Competition is fierce and the customer relationship is often transactional. You can dive deeper into industry-specific retention rates to get a feel for where you might fit.
Benchmarks for SaaS Companies
Now, let's bring it back to the world of SaaS. For most SaaS businesses, a "good" annual customer retention rate lands somewhere between 90% and 97%. But even that has its own nuances, depending on who you're selling to:
- Enterprise SaaS: If you're serving huge enterprise clients, you should be aiming for the top of that range—think 95% or more. These customers have high switching costs and are looking for a true long-term partner.
- Mid-Market SaaS: For businesses targeting mid-sized companies, a retention rate in the 90% to 95% ballpark is a solid goal.
- SMB SaaS: If your focus is on small businesses, you can expect retention to be a bit lower, usually between 80% and 90%. Smaller clients are naturally more sensitive to price and more likely to churn if a better deal comes along.
When you understand these distinctions, you can finally move past vague, generic targets. Instead of just chasing a high number for the sake of it, you can set ambitious goals that are grounded in the reality of your market. This is how you accurately gauge success with your customer retention metrics and make smarter decisions that lead to real, sustainable growth.
3 Smart Strategies to Improve Your Customer Retention Metrics
Knowing your retention numbers is one thing, but actually improving them is where the magic happens. Moving from data on a dashboard to real-world results means you need a solid game plan—one designed not just to keep customers, but to make them so happy they wouldn't dream of leaving.
This isn't about some massive, overnight overhaul. It's about smart, targeted changes that address the real reasons people stick around. From that very first sign-up to their hundredth login, every single touchpoint is a chance to earn their loyalty.

Here are the strategies that turn casual users into your biggest fans.
1. Design a Frictionless Onboarding Experience
You only get one chance to make a first impression, and in SaaS, those first few days are everything. A clunky or confusing onboarding is the fastest ticket to churn. The mission is simple: get your new users to that "aha!" moment—where they truly get your product's value—as fast as humanly possible.
- Guided Product Tours: Forget showing off every single feature at once. Instead, use interactive walkthroughs to steer new users toward the key actions that will make them successful right away.
- Welcome Email Series: Set up an automated email sequence to drip-feed helpful tips, highlight important features, and share success stories. This keeps them learning and engaged even when they aren't logged in.
- In-App Checklists: A simple checklist gamifies the setup. It gives users a clear path, encourages them to complete vital steps, and provides a little hit of accomplishment along the way.
2. Build a Robust Customer Feedback Loop
You can’t fix what you don’t know is broken. Actively seeking out—and acting on—customer feedback is the only way to spot friction points before they turn into reasons for leaving. This turns your customer support from a reactive fire-fighting department into a proactive retention machine.
For instance, after a support ticket is closed, automatically send a single-question survey: "How did we do today?" When you collect that data over time, you start seeing trends in your service quality. For more on this, exploring customer retention best practices can offer some fantastic ideas.
Creating multiple channels for feedback—like surveys, in-app widgets, and community forums—does more than just collect data. It gives your customers a voice and proves you're listening. That alone builds incredible goodwill.
3. Develop Genuinely Rewarding Loyalty Programs
A great loyalty program makes customers feel appreciated for sticking with you. The secret is offering rewards that feel both achievable and genuinely valuable, giving them a compelling reason to stay rather than shop around.
Think bigger than just throwing discounts at them. Try offering perks like:
- Tiered Rewards: Create levels like Bronze, Silver, and Gold that unlock better benefits as customers spend more or stick around longer. It gives them something to aspire to.
- Exclusive Access: Give your most loyal customers a sneak peek at new features or access to exclusive content. This kind of "insider" status is often more valuable than a discount.
- Points-Based Systems: Let customers rack up points for things like purchases, referrals, or even just leaving a review. They can then cash these in for credits or other rewards.
By putting these strategies into practice consistently, you’ll stop just watching your retention metrics and start actively driving them toward growth.
Mapping Retention Metrics to the Customer Journey
Your retention metrics are far more than just numbers on a dashboard; they’re your business's vital signs. Looking at them in isolation gives you a vague sense of health, like a simple temperature check. But when you map them to the specific stages of the customer journey, they become a high-resolution MRI, showing you precisely where your customer experience is thriving and where it's breaking down.
This approach turns your data into a story. Each metric becomes a chapter, revealing how customers feel and act at the most critical moments. It allows you to stop making broad assumptions and start creating targeted, effective fixes that genuinely move the needle.
The need for this detailed view has never been more urgent. Globally, the cost to acquire a new customer has skyrocketed by nearly 60% in the last five years. In fact, many businesses lose an average of $29 for every new customer they sign. As you can see in this detailed analysis, when acquisition is that expensive, you simply can't afford to have blind spots in your customer's journey.
Connecting Metrics to Lifecycle Stages
To make your data truly useful, you have to align the right metric with the right phase of the customer experience. This ensures you’re tracking the correct indicators at the right time, helping you spot friction long before it escalates into churn.
Here’s a practical way to break it down:
Acquisition & Onboarding: The early days are a race to prove your product's value. Your focus here should be locked on metrics like Time to First Value (TTFV) and Product Adoption Rate. A low adoption rate at this stage is a massive red flag. It’s a clear signal that your onboarding isn't getting users to that crucial "aha!" moment.
Engagement & Growth: Once a customer is settled in, the game shifts to deepening their reliance on your product. This is where your Net Promoter Score (NPS) and Customer Health Score become indispensable. A dip in either of these scores can predict future churn, giving you a window to step in with proactive support or helpful training.
Advocacy & Expansion: In the final stage, your best customers become your secret weapon for growth. Here, you need to watch your Customer Lifetime Value (CLV) and Referral Rate. A high CLV paired with a steady stream of referrals is the ultimate sign that you're not just keeping customers—you're turning them into powerful advocates.
By assigning specific customer retention metrics to each stage, you create a powerful system of checks and balances. You can pinpoint exactly where users are falling off and focus your resources on fixing the root cause, whether it's a clunky onboarding flow or poor discovery of advanced features.
This structured approach also sharpens your communication. Knowing where a customer is in their journey lets you tailor your messaging, which is fundamental to building loyalty today. For more on this, our guide on customer communication strategies provides some great ideas. Ultimately, this alignment transforms your metrics from reactive scores into a proactive roadmap for building lasting relationships.
Frequently Asked Questions About Customer Retention Metrics
Even after you get the hang of the basics, some practical questions always seem to come up when you start putting customer retention metrics to work. Let’s clear up a few of the most common ones so you can move forward with confidence.

What is the difference between customer churn and revenue churn?
Think about it this way: customer churn tracks the number of customers you've lost, while revenue churn tracks the dollar amount that walked out the door with them.
Imagine you lost five customers last month. If those were all small accounts on your basic plan, the financial hit is manageable. But what if those five customers were your biggest enterprise clients? The customer churn number is identical—five—but the impact on your bottom line is dramatically different.
That’s why revenue churn gives you a much more honest look at your company's financial health. It tells you the real monetary story behind your departures, which is essential for accurate forecasting and making smart business decisions.
How often should I track my retention metrics?
The right answer really depends on the specific metric and what you're hoping to learn from it. For most SaaS businesses, a mix of monthly and quarterly tracking strikes the perfect balance.
- Monthly Tracking: It's a good idea to watch metrics like Customer Churn Rate and Revenue Churn every month. This frequency lets you catch problems as they arise without getting whiplash from the normal ups and downs of a single week.
- Quarterly Review: For the bigger-picture metrics like Customer Lifetime Value (CLV) and Net Promoter Score (NPS), a quarterly check-in usually makes more sense. These numbers reflect long-term trends and sentiment, so looking at them over a 90-day period gives you a more stable and meaningful view.
This rhythm helps you keep a pulse on the day-to-day health of the business while still keeping your long-term strategic goals in focus.
What is the single most important retention metric?
If I had to pick just one metric to put on a dashboard, it would be Net Revenue Churn. It’s arguably the most powerful sign of a sustainable SaaS business.
Net Revenue Churn is so revealing because it doesn't just track lost revenue from cancellations. It balances that loss against any new revenue you've gained from your existing customers through upgrades or add-ons (expansion MRR).
When this number goes negative, you've hit the holy grail: "negative churn." This means the new revenue from your happy, expanding customers is greater than the revenue you lost from the ones who left. It’s the ultimate proof that you’ve built something valuable that customers are willing to grow with.
Ready to turn your website visitors into loyal, high-value customers? Worknet.ai transforms how you engage users at every stage of their journey. Our AI-powered chat helps you convert more trials, proactively support customers to boost retention, and uncover expansion opportunities automatically. See how it works at https://worknet.ai.
FAQs
.png)
Lorem ipsum dolor sit amet, consectetur adipiscing elit. Suspendisse varius enim in eros elementum tristique. Duis cursus, mi quis viverra ornare, eros dolor interdum nulla, ut commodo diam libero vitae erat. Aenean faucibus nibh et justo cursus id rutrum lorem imperdiet. Nunc ut sem vitae risus tristique posuere.
Lorem ipsum dolor sit amet, consectetur adipiscing elit. Suspendisse varius enim in eros elementum tristique. Duis cursus, mi quis viverra ornare, eros dolor interdum nulla, ut commodo diam libero vitae erat. Aenean faucibus nibh et justo cursus id rutrum lorem imperdiet. Nunc ut sem vitae risus tristique posuere.
Lorem ipsum dolor sit amet, consectetur adipiscing elit. Suspendisse varius enim in eros elementum tristique. Duis cursus, mi quis viverra ornare, eros dolor interdum nulla, ut commodo diam libero vitae erat. Aenean faucibus nibh et justo cursus id rutrum lorem imperdiet. Nunc ut sem vitae risus tristique posuere.
Lorem ipsum dolor sit amet, consectetur adipiscing elit. Suspendisse varius enim in eros elementum tristique. Duis cursus, mi quis viverra ornare, eros dolor interdum nulla, ut commodo diam libero vitae erat. Aenean faucibus nibh et justo cursus id rutrum lorem imperdiet. Nunc ut sem vitae risus tristique posuere.
Lorem ipsum dolor sit amet, consectetur adipiscing elit. Suspendisse varius enim in eros elementum tristique. Duis cursus, mi quis viverra ornare, eros dolor interdum nulla, ut commodo diam libero vitae erat. Aenean faucibus nibh et justo cursus id rutrum lorem imperdiet. Nunc ut sem vitae risus tristique posuere.
Lorem ipsum dolor sit amet, consectetur adipiscing elit. Suspendisse varius enim in eros elementum tristique. Duis cursus, mi quis viverra ornare, eros dolor interdum nulla, ut commodo diam libero vitae erat. Aenean faucibus nibh et justo cursus id rutrum lorem imperdiet. Nunc ut sem vitae risus tristique posuere.
Lorem ipsum dolor sit amet, consectetur adipiscing elit. Suspendisse varius enim in eros elementum tristique. Duis cursus, mi quis viverra ornare, eros dolor interdum nulla, ut commodo diam libero vitae erat. Aenean faucibus nibh et justo cursus id rutrum lorem imperdiet. Nunc ut sem vitae risus tristique posuere.
Lorem ipsum dolor sit amet, consectetur adipiscing elit. Suspendisse varius enim in eros elementum tristique. Duis cursus, mi quis viverra ornare, eros dolor interdum nulla, ut commodo diam libero vitae erat. Aenean faucibus nibh et justo cursus id rutrum lorem imperdiet. Nunc ut sem vitae risus tristique posuere.
Lorem ipsum dolor sit amet, consectetur adipiscing elit. Suspendisse varius enim in eros elementum tristique. Duis cursus, mi quis viverra ornare, eros dolor interdum nulla, ut commodo diam libero vitae erat. Aenean faucibus nibh et justo cursus id rutrum lorem imperdiet. Nunc ut sem vitae risus tristique posuere.
Lorem ipsum dolor sit amet, consectetur adipiscing elit. Suspendisse varius enim in eros elementum tristique. Duis cursus, mi quis viverra ornare, eros dolor interdum nulla, ut commodo diam libero vitae erat. Aenean faucibus nibh et justo cursus id rutrum lorem imperdiet. Nunc ut sem vitae risus tristique posuere.

.webp)
.webp)
.webp)


