A Practical Guide on How to Measure Customer Engagement
To truly understand customer engagement, you must first define what a valuable interaction means for your business. This isn't about chasing vanity metrics; it's about connecting specific customer actions—like using a key product feature or making a second purchase—directly to your most important business goals. This is how you shift from vague ideas to a concrete, actionable strategy for measuring customer engagement.
What Does Customer Engagement Really Mean for Your Business?
Before you can measure anything, you must establish what "engagement" means in the context of your company. A valuable interaction for a SaaS business could be completely irrelevant to an e-commerce brand. The actions that truly matter are dictated by your unique business model, your product, and your strategic objectives.
For instance, a software company might consider a user "engaged" if they log in daily, adopt a new feature within the first week, and invite a teammate. In contrast, an e-commerce store would define engagement through repeat purchases, product reviews, and social media mentions. Your first task is to pinpoint the exact user behaviors that correlate with revenue and retention.
My Take: Engagement isn't a single number. It’s a mosaic of user actions that proves they're getting real, ongoing value from you. A solid definition bridges the gap between what users do and what your business needs them to do.
Moving From Vague Goals to Tangible Metrics
To make this practical, you need to be specific. What precise actions do your most loyal and profitable customers take? The answers to this question are the foundation of your entire measurement plan. Without this clarity, you risk tracking metrics that look impressive on a dashboard but don't actually contribute to business growth.
- For a SaaS business: Instead of just reporting on "daily active users," focus on the Feature Adoption Rate for your latest release. This metric tells you if customers are growing with your product, not just logging in out of habit.
- For an e-commerce store: Don't get fixated on website traffic. Dig into the Purchase Frequency and Average Order Value of your repeat buyers. These are the metrics that signal loyalty and predict a high customer lifetime value.
To help visualize this, here are three foundational metrics that offer a great starting point for almost any business.
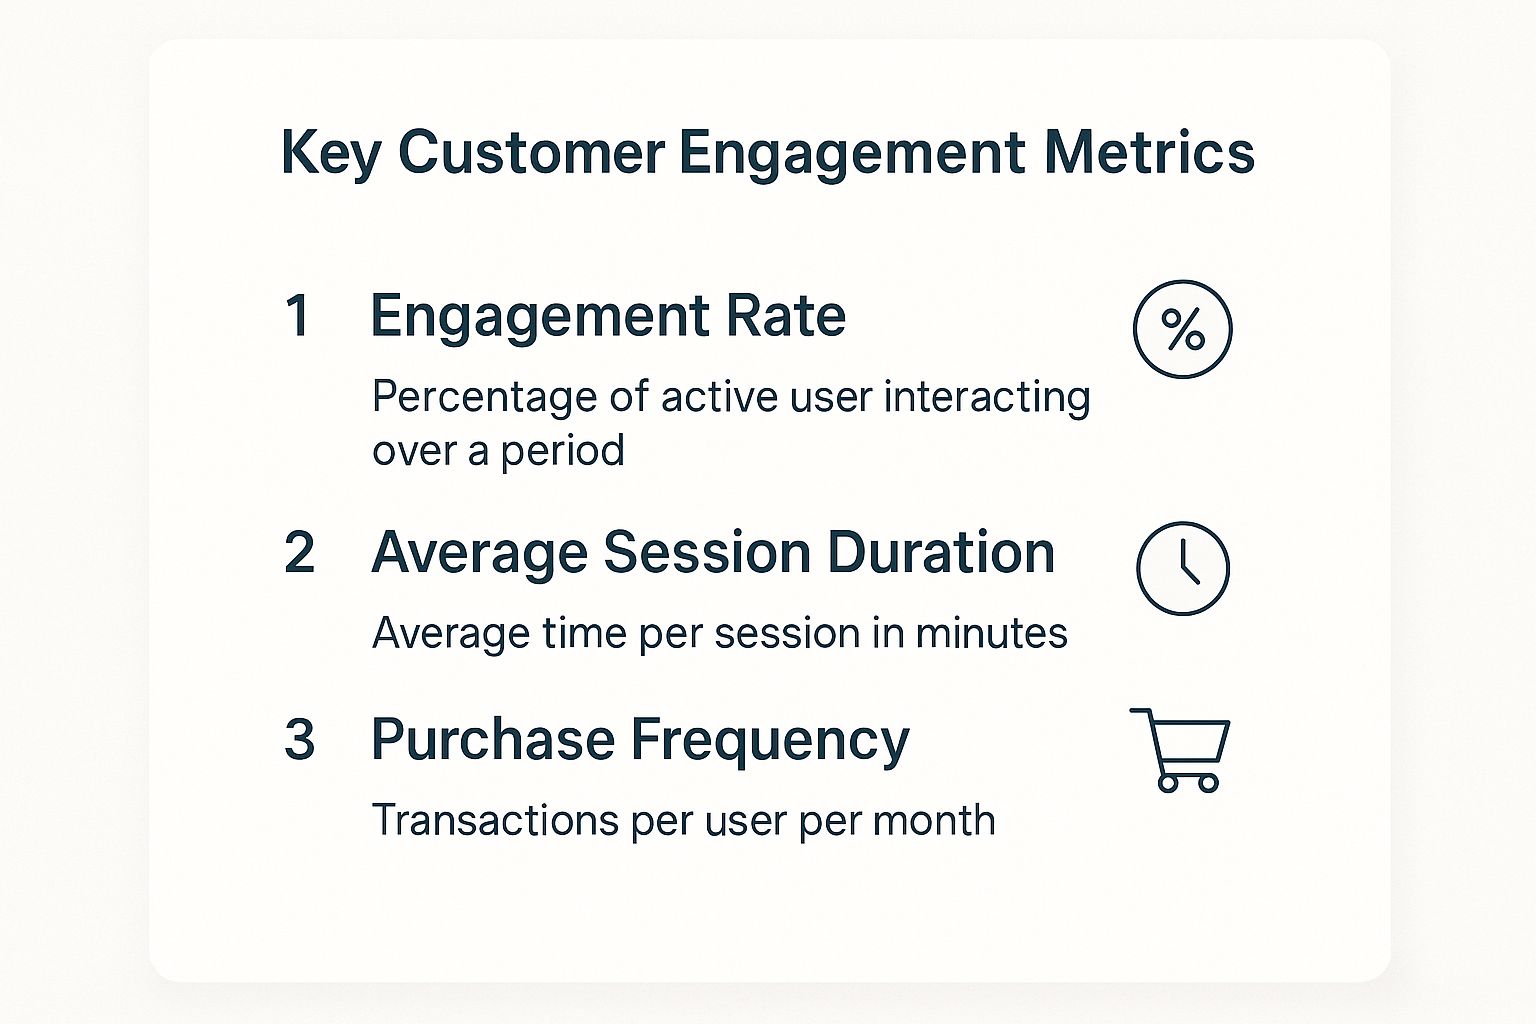
As you can see, a strong measurement framework combines different types of metrics—from how long someone stays to how much they spend—to create a complete picture. The numbers tell you what is happening, but it’s the combination that starts to reveal the why.
Tying Engagement Metrics to Business Outcomes
The real impact comes when you connect these specific user actions to your core business objectives, whether that’s growing revenue, boosting retention, or reducing churn. This alignment is critical because it ensures your team is focused on activities that genuinely drive results.
When you can confidently say, "Customers who complete Action X are 50% less likely to churn," you've uncovered a powerful lever you can pull to accelerate growth.
A clear, actionable definition makes measurement strategic, not just a reporting exercise. Once you’ve nailed down what to track, you can start exploring ways to encourage those key behaviors. For more on that, our guide on how to improve customer engagement is a great next step for turning these insights into results.
Tracking What Users Do With Behavioral Metrics

Now that you’ve defined what engagement means for your business, it’s time to get into the details: tracking what people actually do. This is where behavioral metrics come in. They are the foundation for measuring customer engagement because they provide objective data on how people interact with your product or website. This goes far beyond simple page views.
What we’re really after are signals of product stickiness—the kind of engagement that shows you're providing genuine, recurring value. Think of it like a retail store. A page view is just someone walking through the door. The real story is in what they pick up, how long they browse, and what they ultimately buy.
Gauging Product Stickiness with Active User Ratios
For any SaaS platform, one of the most revealing metrics is the Daily Active Users to Monthly Active Users (DAU/MAU) ratio. This number tells you how often your customers come back, which is a powerful indicator of how integral your product is to their daily or weekly routines.
A high DAU/MAU ratio is a fantastic signal that your product has become a habit. For example, a ratio of 50% means your average user is active for 15 days out of a 30-day month—a very sticky product. Conversely, a low ratio might suggest people only log in for specific, infrequent tasks, signaling an opportunity to deliver more consistent value.
Understanding User Intent with Session Metrics
Session metrics are all about telling the story of a single visit. While many people track Average Session Duration, on its own, it can be misleading. Is a long session always a good thing? It could also mean the user is lost and can't find what they need.
That’s why you need to pair it with Pages per Session, sometimes called Session Depth. This adds crucial context. If someone visits a product page, then your pricing page, and then proceeds to checkout, that sequence of visiting multiple relevant pages shows strong purchasing intent.
My Takeaway: Don't just look at how long someone stays; look at what they accomplish. A long session that ends with a purchase or a completed action tells a much clearer story than duration alone.
For example, at Worknet.ai, we watch how many users engage with our AI chat, then move to a features page, and ultimately book a demo. That specific path is a clear indicator of a successful, high-value engagement.
Measuring Value Realization with Feature Adoption
If you're a product-led company, the Feature Adoption Rate is a non-negotiable metric. It shows what percentage of your users are actually trying a new feature after launch. A low number is a major red flag that could point to several problems:
- A Marketing Gap: Did you effectively announce the new feature to your users? Was the value proposition clear?
- A UX Flaw: Is the feature buried in a menu or difficult to use?
- A Value Mismatch: You may have built something you thought was brilliant, but your customers simply don't need it.
Tracking feature adoption is how you confirm that your product is evolving with your customers. By seeing which features get the most use, you get direct feedback on where people find the most value. This insight should directly inform your product roadmap. When combined, these behavioral metrics provide a rich, detailed picture of engagement that goes far beyond surface-level data.
Understanding How Customers Feel With Attitudinal Data

Behavioral metrics are excellent at showing you what your customers are doing, but they can't explain the why. This is where attitudinal data becomes your most valuable asset. It’s the only way to gain real insight into your customers' thoughts, feelings, and perceptions. To genuinely understand engagement, you must connect their actions to their emotions.
Think of it this way: attitudinal metrics measure the sentiment behind the clicks. They're the difference between knowing someone spent ten minutes on your site and knowing they found the experience intuitive and valuable. This qualitative layer is what elevates a good engagement strategy to a great one.
Key Metrics for Gauging Customer Sentiment
I've found that three core metrics provide a solid framework for capturing customer sentiment at different points in their journey. Each one answers a very specific question about their experience.
Net Promoter Score (NPS): A classic for a reason, NPS measures long-term loyalty with a single, powerful question: "How likely are you to recommend our company/product to a friend or colleague?" It's a fantastic barometer for overall brand health and customer advocacy.
Customer Satisfaction (CSAT): CSAT is about the "right now." It measures short-term happiness immediately following a specific interaction, like finishing a support chat or making a purchase. A quick "How satisfied were you with this experience?" helps you pinpoint friction points or celebrate service wins.
Customer Effort Score (CES): This metric gets to the heart of usability. CES asks something like, "How easy was it to get your issue resolved?" A low-effort experience is a massive driver of loyalty; in fact, 94% of customers who have a low-effort interaction will come back to buy again.
These scores translate feelings into numbers you can track, giving you the context needed to make sense of your behavioral data.
My Takeaway: Don't just stare at these scores on a dashboard. The real magic is in the follow-up question. Always ask, "Why did you give that score?" That’s where you’ll find the honest, actionable feedback that actually helps you improve.
Uncovering Deeper Insights from Qualitative Feedback
Beyond structured surveys, a goldmine of attitudinal data is hiding in plain sight. I'm talking about unstructured feedback—online reviews, social media comments, support ticket transcripts, and sales call notes. This is where you find the raw, unprompted opinions from your customer base.
When you start analyzing this qualitative data, you'll see themes emerge. Are multiple people complaining about the same confusing checkout step? Are customers consistently raving about a specific feature? This kind of feedback provides a rich story that numbers alone just can't tell.
By combining this qualitative feedback with your behavioral data and sentiment scores, you create a complete, 360-degree view of your customer. It finally connects what they did with why they did it. That connection is what allows you to make smarter, more empathetic decisions for your business. For a deeper dive, exploring key client success metrics can help you build an even stronger measurement framework focused on customer happiness.
Using Analytics Tools For Deeper Insights

So, you've pinpointed your key metrics and started collecting data. Now it's time to turn that raw information into intelligence you can actually use. This is where modern analytics tools, especially those with AI at their core, excel. They're designed to sift through mountains of data and identify the valuable patterns you’d otherwise miss.
Thankfully, you no longer need a massive budget or a dedicated data science team to get these kinds of insights. Powerful, user-friendly platforms are now accessible to businesses of all sizes, making it easier than ever to truly understand your customers.
How AI Changes Engagement Analysis
When it comes to figuring out how to measure customer engagement, artificial intelligence is a game-changer. AI algorithms can analyze behavioral and attitudinal data at a scale and speed that is simply beyond human capability. This is how you uncover the hidden correlations and predictive insights that fuel real growth.
For example, an AI model might identify a fascinating trend: customers who use your AI chat support for more than two minutes are 40% more likely to adopt a new feature within the next 30 days. That’s not just an interesting stat; it’s a strategic insight you can build a campaign around.
My Takeaway: AI isn't just about faster reporting. It's about getting ahead of the curve. You stop asking "what happened?" and start answering "what will happen next?" and, more importantly, "what should we do about it?"
Building Your Analytics Tech Stack
Choosing the right analytics tools is a balance of capability and usability. The goal isn't to collect a dozen different platforms. Instead, you want a core set of tools that integrate well and directly support your main objectives.
A solid tech stack usually includes:
- Web & Product Analytics: This is your foundation for tracking what users do. Think Google Analytics or Mixpanel.
- Customer Data Platform (CDP): A CDP acts as your central hub, unifying user data from all your sources into a single, clean profile for each customer.
- AI-Powered Chat: Solutions like Worknet.ai are invaluable. They don't just talk to users; they capture priceless conversational data that reveals what users want and how they feel, right in the moment.
The market for these solutions is booming for a reason. Valued at USD 23.45 billion in 2023, the global customer engagement solutions market is projected to hit USD 50.03 billion by 2030, largely thanks to the rise of AI. This massive growth underscores how essential these technologies have become. You can dive deeper into these market trends in this detailed industry report.
Turning Data Collection into Real Action
At the end of the day, you use these tools to automate the tedious work of data collection so you can focus on analysis and action. When your data flows seamlessly between your systems, you can create a single dashboard that gives you a clear, real-time view of the metrics that matter most.
Imagine this: you notice your Net Promoter Score (NPS) has dipped. With a connected system, you can instantly drill down. You can read the qualitative feedback from detractors, check their behavioral data to see which features they struggled with, and even pull up their chat transcripts from Worknet.ai to find the exact source of their frustration.
This is how you turn a vague problem into a specific, fixable issue. By investing in the right technology, you empower your team to find these critical insights quickly and consistently.
Weaving Together a Unified Customer View with Omnichannel Data
Your customers don’t live in a vacuum, so why should their data? They move between your website, mobile app, social media, and email—sometimes all in the same day. If you really want to understand how to measure customer engagement, you have to stop looking at these channels individually and start seeing the complete picture.
A single metric, like one website visit, is just a tiny piece of a much bigger puzzle. The real story emerges when you connect that visit to the social media comment they left last week and the email they opened this morning. This holistic view is the only way to genuinely map the customer journey and understand what’s actually working.
From Data Silos to a Single Customer Profile
The biggest challenge most businesses face is unifying all that scattered data. This is where a Customer Data Platform (CDP), like Segment or Tealium, becomes invaluable. Think of a CDP as the central nervous system for your customer information, ingesting data from every channel to build one unified profile for each person.
Suddenly, a website visitor and an email subscriber aren't two separate entities; they're the same person interacting with you in different places. This is a massive advantage because it allows you to trace their path from their very first touchpoint all the way to purchase and beyond.
My Takeaway: A unified customer view completely changes the game. Instead of looking at a bunch of disconnected snapshots, you're watching a story unfold. You can finally see how one interaction leads to another, giving you a much clearer sense of what truly drives engagement and loyalty.
This shift toward an omnichannel approach is what separates modern measurement from outdated methods. By integrating touchpoints like your website, app, social media, and even AI-powered chatbots, you can capture incredibly detailed data on everything from session duration to channel preferences. In fact, many leading companies now use these "engagement hubs" to get a 360-degree view of every customer interaction, as highlighted in this market research report.
Mapping the Cross-Channel Journey
Once all your data is in one place, you can begin mapping the cross-channel journey. This is where you connect the dots and see how different touchpoints influence each other.
Here’s what this looks like in practice:
- Social to Purchase: You can finally track a customer who clicks an Instagram ad, browses your site, leaves, and then returns a day later through a follow-up email to make a purchase.
- Support to Upsell: A user chats with your AI bot for a support question. A week later, they click an in-app notification about a premium feature you recommended based on their previous issue.
- Content to Conversion: Someone reads three of your blog posts over a month, then signs up for a webinar, and finally books a product demo.
Seeing these pathways clearly shows you which channels are most effective at moving customers forward. It also reinforces how critical consistent and effective customer communication strategies are on every platform. This is how you build a measurement system that truly reflects the complex reality of modern customer relationships.
Answering Your Top Customer Engagement Questions
Even with a perfect plan on paper, a few practical questions always arise when it's time to actually start measuring customer engagement. This is where theory meets reality. Let's tackle some of the most common questions I hear from teams who are just getting started or looking to refine their approach.
"We Have Nothing in Place. Where Do We Even Begin?"
If you're starting from scratch, it's easy to feel overwhelmed. The most common mistake is trying to build a massive, complex measurement system from day one. Instead, the key is to start small and focused.
First, get your team to agree on a simple definition: What does an "engaged customer" look like for our business? Is it someone who logs in daily? Someone who makes a repeat purchase within 90 days? Or perhaps someone who refers a friend? This definition becomes your North Star.
Once you have that definition, pick just 3-5 key metrics that directly track that behavior. You can get started without a large budget.
- For user behavior: Dive into Google Analytics. It's free and incredibly powerful. Start tracking basics like Average Session Duration, Pages per Session, and Conversion Rates on your most important pages.
- For user sentiment: Use a free form builder to create a simple, one-question Customer Satisfaction (CSAT) survey. Send it out automatically after a key interaction, like a support ticket being closed.
Your goal here isn't perfection; it's about establishing a baseline. This initial data provides a foundation to build on as your strategy becomes more sophisticated. It’s the essential first step to understanding how to measure customer engagement from the ground up.
"How Does AI Actually Help Measure Engagement?"
Artificial intelligence has moved far beyond being a buzzword; it fundamentally changes what you can see and do with your customer data. AI gives you a significant advantage by making your measurement smarter, not just bigger.
Consider this: a study of 1,900 marketing leaders revealed that 79% of organizations are already using AI to automate customer interaction tasks. Even more telling, brands using AI for quality assurance are 20% more likely to beat their competitors in engagement.
So, how does it work in practice?
- It finds hidden patterns: AI algorithms can sift through enormous, complex datasets to spot subtle user behavior trends that a human analyst would almost certainly miss.
- It helps you predict outcomes: Instead of just reacting when a customer leaves, AI can build predictive models for churn. This allows you to intervene with the right message or offer before you lose them.
- It enables true personalization: AI is the engine that allows you to deliver highly relevant, one-to-one experiences at scale. The measurable lift from these personalized campaigns becomes a powerful engagement metric in its own right.
"How Often Should We Be Looking at These Metrics?"
There's no single right answer here—the ideal review schedule depends entirely on the metric itself. Checking everything daily will lead to over-analysis and knee-jerk reactions. But waiting too long means you'll miss crucial signals.
The best approach is to categorize your metrics into different tiers based on how you'll use them.
- Strategic Health Metrics (Monthly/Quarterly Review): These are your big-picture numbers. Think Monthly Active Users (MAU), Net Promoter Score (NPS), or Customer Lifetime Value (CLV). Reviewing these on a longer timeline helps you spot slow-moving, meaningful trends without getting bogged down in daily fluctuations.
- Operational Metrics (Weekly/Bi-Weekly Review): This tier is for your more tactical data. Things like feature adoption rates after a new release or the performance of a specific marketing campaign fit here. A weekly check-in provides enough data to see a real pattern while allowing you to remain agile enough to make changes.
- Real-Time Metrics (Daily/Constant Monitoring): A select few metrics need to be on a live dashboard. Critical error rates, website uptime, or a sudden spike in negative support tickets fall into this category. These are your "canary in the coal mine" indicators that demand immediate attention when they go off.
Ultimately, you want to create a reporting rhythm that matches your team’s ability to make decisions and take action.
Ready to turn site visitors into loyal customers? Worknet.ai transforms how you engage with users at every stage of their journey. Our proactive, AI-powered chat helps you guide visitors, convert trials, and support customers—all through one unified experience. Discover how Worknet.ai can help you drive retention and grow lifetime value.
FAQs
.png)
Lorem ipsum dolor sit amet, consectetur adipiscing elit. Suspendisse varius enim in eros elementum tristique. Duis cursus, mi quis viverra ornare, eros dolor interdum nulla, ut commodo diam libero vitae erat. Aenean faucibus nibh et justo cursus id rutrum lorem imperdiet. Nunc ut sem vitae risus tristique posuere.
Lorem ipsum dolor sit amet, consectetur adipiscing elit. Suspendisse varius enim in eros elementum tristique. Duis cursus, mi quis viverra ornare, eros dolor interdum nulla, ut commodo diam libero vitae erat. Aenean faucibus nibh et justo cursus id rutrum lorem imperdiet. Nunc ut sem vitae risus tristique posuere.
Lorem ipsum dolor sit amet, consectetur adipiscing elit. Suspendisse varius enim in eros elementum tristique. Duis cursus, mi quis viverra ornare, eros dolor interdum nulla, ut commodo diam libero vitae erat. Aenean faucibus nibh et justo cursus id rutrum lorem imperdiet. Nunc ut sem vitae risus tristique posuere.
Lorem ipsum dolor sit amet, consectetur adipiscing elit. Suspendisse varius enim in eros elementum tristique. Duis cursus, mi quis viverra ornare, eros dolor interdum nulla, ut commodo diam libero vitae erat. Aenean faucibus nibh et justo cursus id rutrum lorem imperdiet. Nunc ut sem vitae risus tristique posuere.
Lorem ipsum dolor sit amet, consectetur adipiscing elit. Suspendisse varius enim in eros elementum tristique. Duis cursus, mi quis viverra ornare, eros dolor interdum nulla, ut commodo diam libero vitae erat. Aenean faucibus nibh et justo cursus id rutrum lorem imperdiet. Nunc ut sem vitae risus tristique posuere.
Lorem ipsum dolor sit amet, consectetur adipiscing elit. Suspendisse varius enim in eros elementum tristique. Duis cursus, mi quis viverra ornare, eros dolor interdum nulla, ut commodo diam libero vitae erat. Aenean faucibus nibh et justo cursus id rutrum lorem imperdiet. Nunc ut sem vitae risus tristique posuere.
Lorem ipsum dolor sit amet, consectetur adipiscing elit. Suspendisse varius enim in eros elementum tristique. Duis cursus, mi quis viverra ornare, eros dolor interdum nulla, ut commodo diam libero vitae erat. Aenean faucibus nibh et justo cursus id rutrum lorem imperdiet. Nunc ut sem vitae risus tristique posuere.
Lorem ipsum dolor sit amet, consectetur adipiscing elit. Suspendisse varius enim in eros elementum tristique. Duis cursus, mi quis viverra ornare, eros dolor interdum nulla, ut commodo diam libero vitae erat. Aenean faucibus nibh et justo cursus id rutrum lorem imperdiet. Nunc ut sem vitae risus tristique posuere.
Lorem ipsum dolor sit amet, consectetur adipiscing elit. Suspendisse varius enim in eros elementum tristique. Duis cursus, mi quis viverra ornare, eros dolor interdum nulla, ut commodo diam libero vitae erat. Aenean faucibus nibh et justo cursus id rutrum lorem imperdiet. Nunc ut sem vitae risus tristique posuere.
Lorem ipsum dolor sit amet, consectetur adipiscing elit. Suspendisse varius enim in eros elementum tristique. Duis cursus, mi quis viverra ornare, eros dolor interdum nulla, ut commodo diam libero vitae erat. Aenean faucibus nibh et justo cursus id rutrum lorem imperdiet. Nunc ut sem vitae risus tristique posuere.

.webp)
.webp)
.webp)


